
Fig 3. Mathematical model predictions.
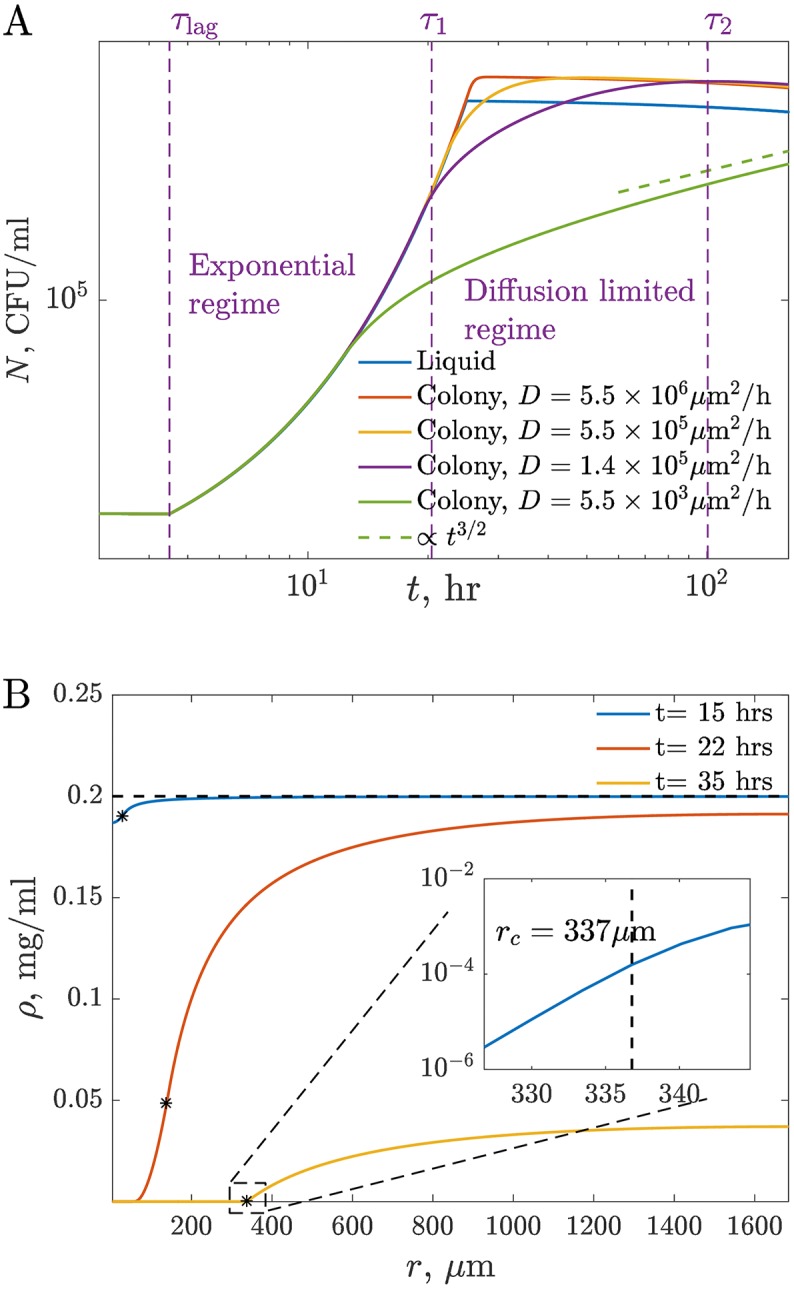
(A) Population growth in liquid culture and in 3-d colonies. The growth parameters are chosen as best fit values for our experimental data (see Table 1), except for D, which we vary to illustrate different growth regimes. The diffusion-limited regime in the limit of small D is consistent with the prediction N ∝ t3/2. The time scales τi are illustrated for D = 1.4 × 105 μm2/hr. (B) Profile of the nutrient concentration in space at different times using the same parameters as above and D = 5.5 × 105 μm2/h, as in Table 1. The edge of the colony is illustrated by stars on each curve. The inset shows that the concentration decreases exponentially at the colony edge in the diffusion-limited growth regime. The penetration depth is about 3 μm.