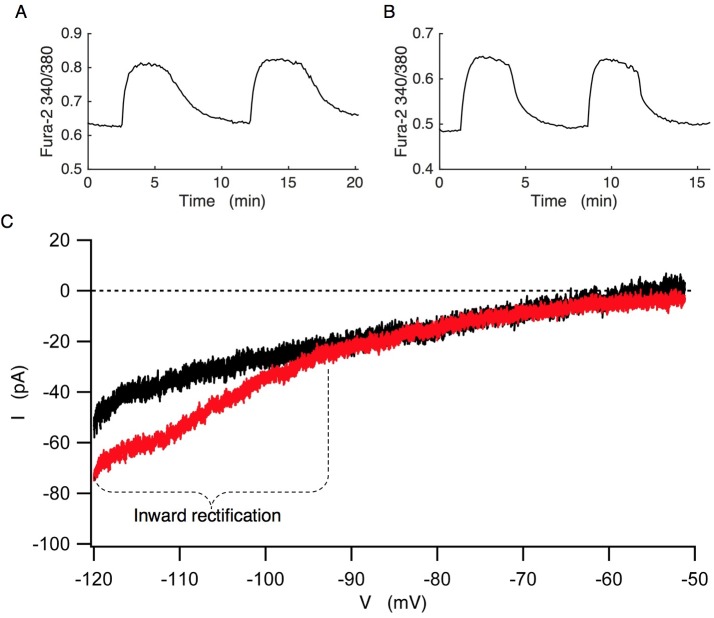
Fig 3.
Fura-2 Ca2+ measurements from wild-type (A) and SUR1-/- islets (B) at 11 mM glucose. The change in Ca2+ is expressed as the Fura-2 340/380 ratio. (C) Comparison of I-V curves from wild-type (black) and SUR1-/- (red) β-cells. The wild-type recording is representative of n = 6 islets isolated from 4 mice. The SUR1-/- recording is representative of n = 8 islets isolated from 5 mice. The SUR1-/- islets exhibited significant inward rectification at more negative potentials compared to cells from wild-type islets.

