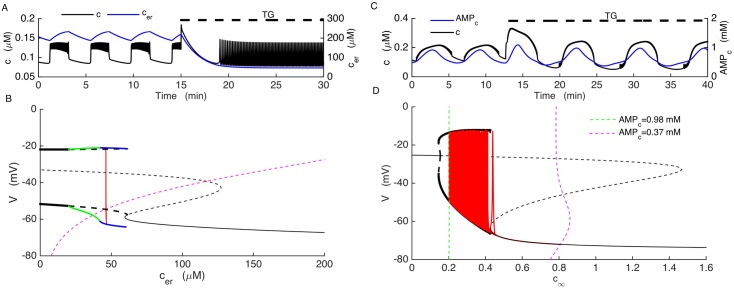
Fig 10. Distinct model predictions of the effects of partial inhibition of SERCA pumps with thapsigargin distinguishes the two models.
(A) In the model where bursting is driven by oscillations in the ER calcium concentration simulation of TG application reduces the cer (red) and terminates slow c oscillations (black). (B) In this model, the z-curve and cer nullcline are shifted far to the left and the periodic spiking branch is destabilized. The new stable periodic branch exhibits fast two-spike bursting at the value of cer at which the trajectory settles. (C) In the model in which bursting is driven by oscillations in the Kir2.1 current, bursting continues after TG application (black) because the AMPc oscillations (red) persist. (D) In this model, TG increases the amplitude of the AMPc oscillations, which shifts the c∞ curve further to the right and increases the period of oscillations, but the burst mechanism is unaltered.

