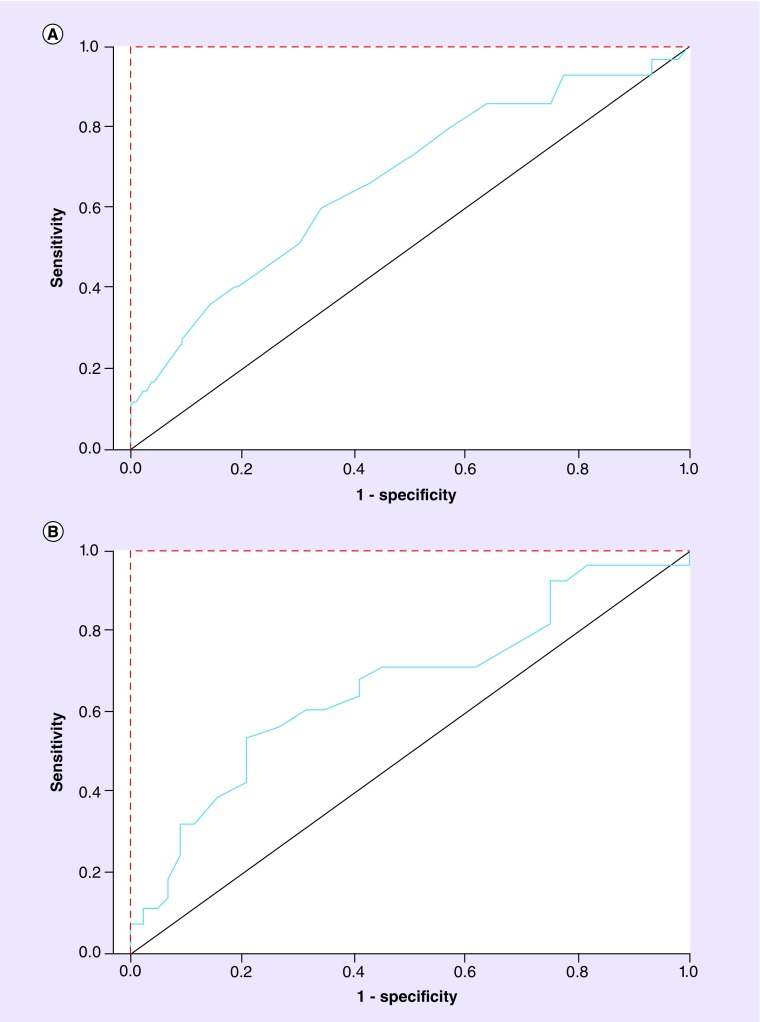
Figure 2. . Receiver operating characteristics curves of (A) plasma Ang-2 concentrations (area under the curve = 0.67) and (B) plasma MMP-2 concentrations (area under the curve = 0.65) in RECIST-defined responders versus non-responders.
Red dotted line: theoretical perfect performance of an efficacy biomarker. Black solid line: theoretical performance of an efficacy biomarker equivalent to a coin toss. Blue line: actual performance of the results.

