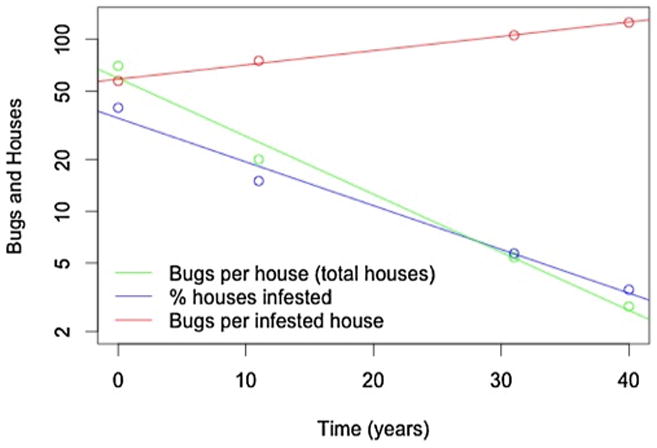
Fig. 2.

Entomological surveillance data for triatomine bugs and triatomine-infested houses from Ache 2001 for the time period of 1958–1998. The blue line indicates the percentage of houses infested with triatomine bugs; we assume the proportion of humans at risk of Chagas disease varies directly with this index. The green line is the average number of triatomine bugs per house, including those that are not infested. The red line is the average number of triatomine bugs per infested house, calculated from the two prior indices. (For interpretation of the references to colour in this figure legend, the reader is referred to the web version of this article.)
