
Fig. 4.
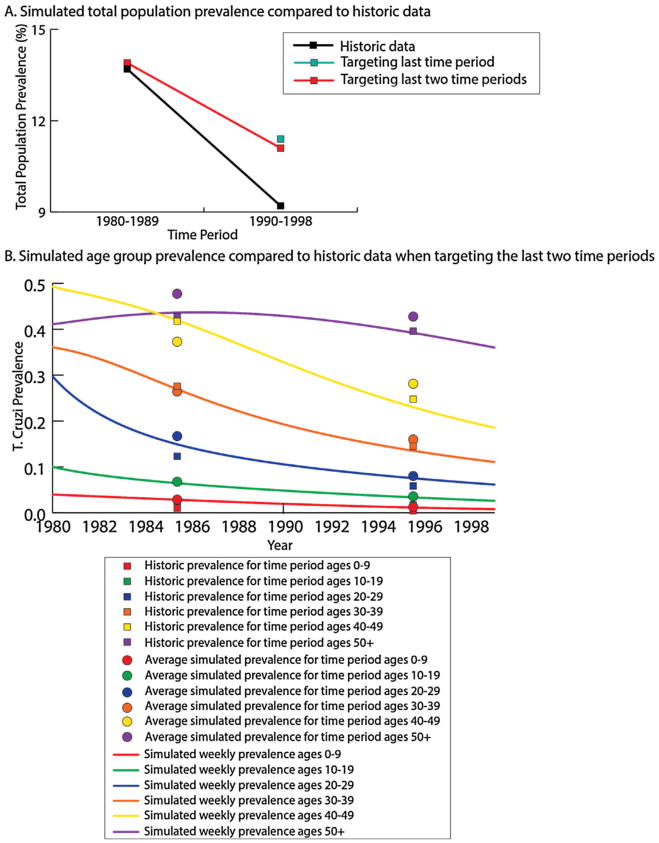
Simulated seroprevalence from the Princeton model for each age group a) T.cruzi seroprevalence in the total population over the four time periods, and b) age-stratified seroprevalence over time with the average simulated seroprevalence compared to the historical seroprevalence when targeting the last two time periods.