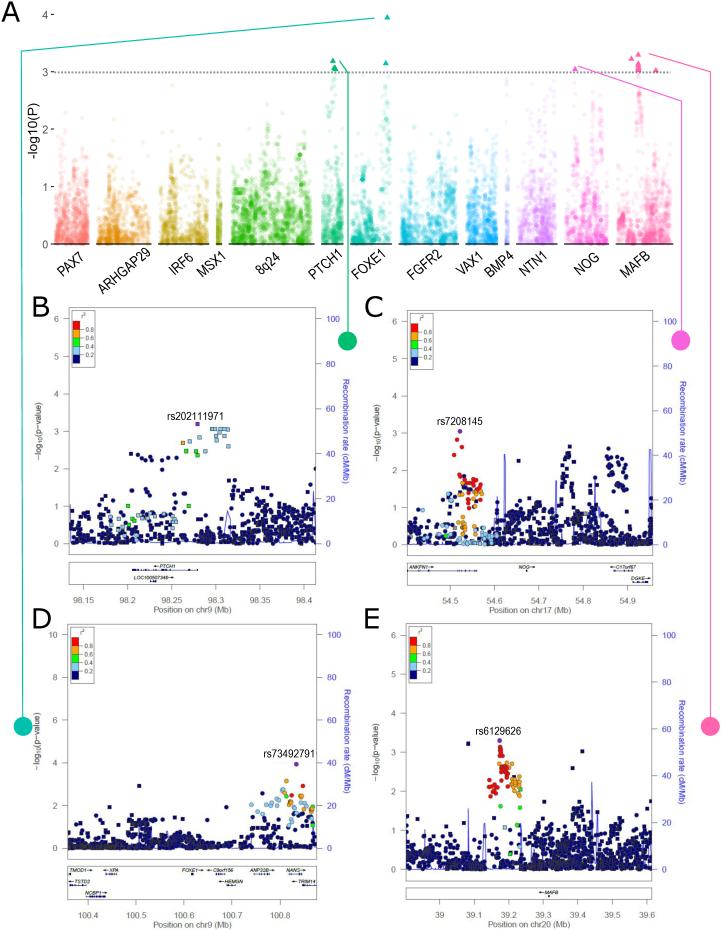
Figure 1. CL vs. CLP cleft type modifiers.
A) Cleft type (CL vs. CLP) association results from the common-variant meta-analysis of Filipino and Chinese populations. (B) – (E) Regional association plots for 9q22 (x2), 17q22, and 20q12 showing −log10(P-values) for SNPs with stronger association with CL (squares) and stronger association with CLP (circles) based on the direction of the odds ratio. Plots were generated using LocusZoom (Pruim et al., 2010). The recombination overlay (blue line, right y-axis) indicates the boundaries of the LD-block. Points are color coded according to pairwise linkage disequilibrium (r2) with the index SNP.

