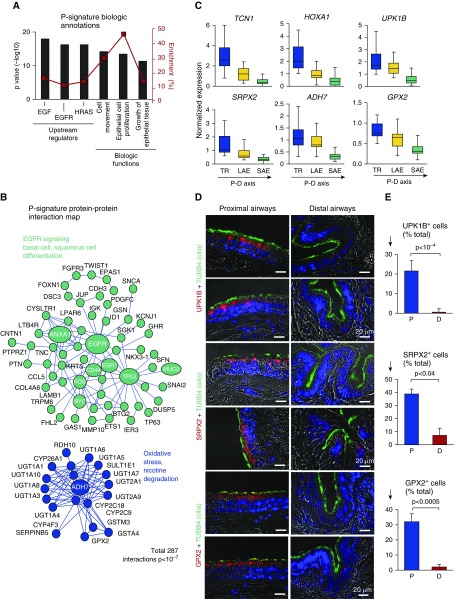
Figure 2.
Proximal airway epithelial signature. (A) Ingenuity Pathway Analysis–based biologic annotation categories enriched in the proximal signature. Shown are the top three Ingenuity Pathway Analysis–predicted upstream regulators and biologic functions based on the P value (bars, left y-axis) and enrichment score (red boxes, right y-axis). (B) STRING9.1-based protein–protein interaction networks in the P signature. Each circle corresponds to an individual gene (see Figure 1C legend for description). (C) Microarray-based normalized expression of selected P signature genes (see Table E3 for full gene names and Figure E3 for more examples, statistics, and TaqMan validation) in the epithelium from the trachea (TR), large airway epithelium (LAE; n = 21), and small airway epithelium (SAE; n = 63) of healthy nonsmokers. Direction of the proximal-to-distal (P–D) axis is shown. (D) Representative images of the P (bronchus) and D airway samples analyzed using immunofluorescence for P-signature genes uroplakin 1B (UPK1B), sushi repeat-containing protein X-linked 2 (SRPX2), and glutathione peroxidase 2 (GPX2) in combination with cilia marker tubulin β4 chain (TUBB4). Nuclei are stained with 4′,6-diamidino-2-phenylindole (blue); scale bar = 20 μm. See Figure E4 for more examples. (E) Frequency of cells expressing UPK1B, SRPX2, and GPX2 in the P and D airway epithelium (nc ≥ c3 samples; total, ≥500 cells per group). ADH7 = alcohol dehydrogenase 7 (class IV); EGF = epidermal growth factor; EGFR = epidermal growth factor receptor; HOXA1 = homeobox A1; HRAS = H-Ras; TCN1 = transcobalamin 1.

