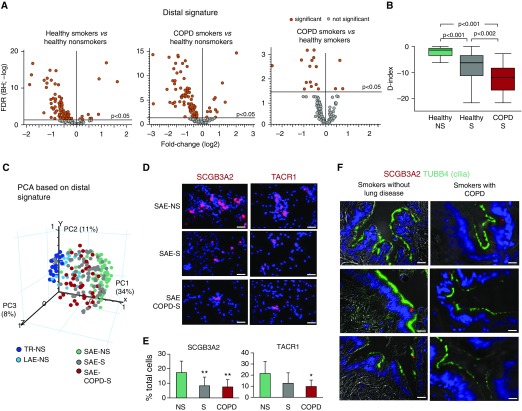
Figure 3.
Down-regulation of distal (D)-signature expression in the small airway epithelium (SAE) in healthy smokers (S) and in smokers with chronic obstructive pulmonary disease (COPD-S). (A) Volcano plots illustrating differential expression of the D-signature gene probes in the SAE of healthy nonsmokers (NS; n = 63), healthy smokers (S; n = 73), COPD-S (n = 37), and significant probe sets (orange; Benjamini-Hochberg [BH]-corrected P < 0.05). (B) Mean D index in the SAE of indicated groups (described in A). Horizontal line within each bar represents the median for each group; P values are based on the Mann-Whitney U test. (C) Principal component analysis (PCA) of epithelial samples from the trachea (TR-NS; n = 27), large airway epithelium (LAE-NS; fourth- to sixth-generation bronchi; n = 21), and distal SAE (samples described in A) of nonsmokers based on the expression of the D-signature gene probes. (D) Representative images of SAE brushing samples from indicated groups analyzed using immunofluorescence for secretoglobin family 3A member 2 (SCGB3A2) and tachykinin receptor 1 (TACR1). Nuclei are stained with 4′,6-diamidino-2-phenylindole (blue); scale bar = 20 μm. See Figure E6 for more images and statistics. (E) SCGB3A2+ and TACR1+ cells (percentage of total) in the SAE brushing samples from NS (n = 9), S (n = 10), and COPD-S (n = 8). *P < 0.05, **P < 0.01. (F) Representative images of D airways of smokers without lung disease and COPD-S (n = 3 per group) analyzed using immunofluorescence for expression of SCGB3A1 (red) and cilia marker tubulin β4 chain (TUBB4) (green); nuclei are stained with 4′,6-diamidino-2-phenylindole (blue); scale bar = 20 μm. FDR = false discovery rate; PC = principal component.

