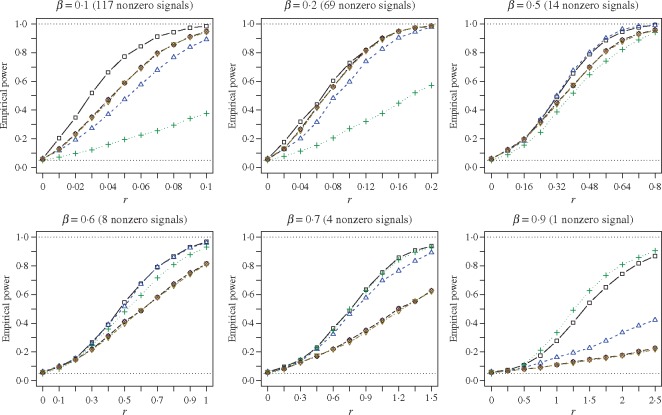
Fig. 1.
Empirical powers of the adaptive sum-of-powers test (squares) and the tests of Chen et al. (2014) (triangles point up), Cai et al. (2014) (plus signs), Bai & Saranadasa (1996) (crosses), Chen & Qin (2010) (diamonds), and Srivastava & Du (2008) (triangles point down). The signal sparsity parameter  varies from
  to
to  .
.

