Figure 3.
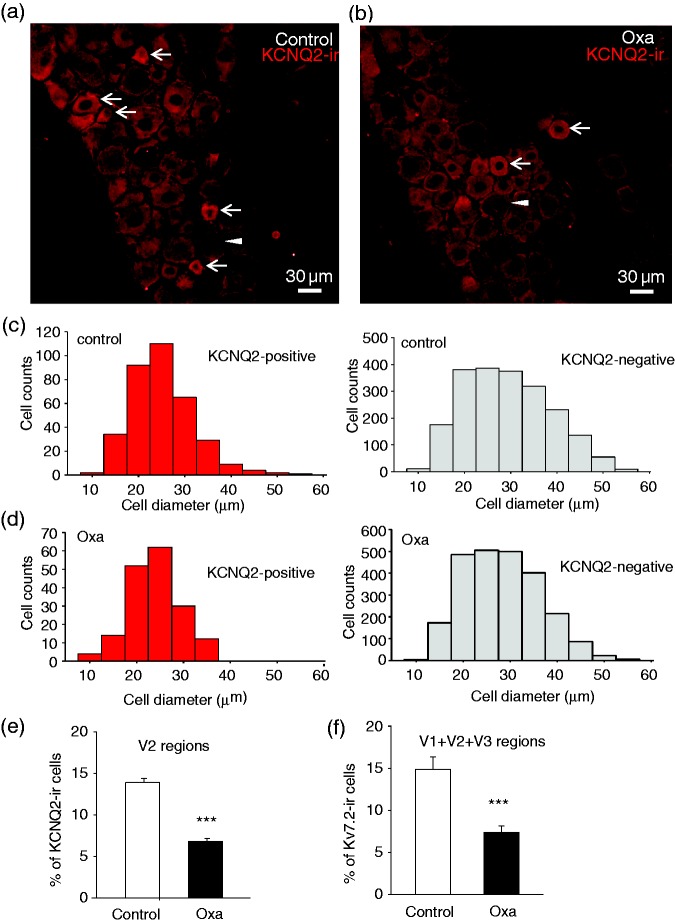
KCNQ2 immunoreactivity in V2 areas of TG of control and oxaliplatin-treated animals. (a) Image shows KCNQ2 immunoreactivity (KCNQ2-ir) in V2 part of a TG section (V2 TG) from a control rat. Arrows indicate KCNQ2-ir positive neurons. A negative neuron is indicated by an arrowhead. (b) Similar to (a) except the TG is harvested from an animal on day 28 following oxaliplatin injections. Arrows indicate KCNQ2-ir positive neurons and a negative neuron is indicated by an arrowhead. (c) Histograms of KCNQ2-ir positive (left panel) and negative (right panel) V2 TG neurons in control rats. (d) Histograms of KCNQ2-ir positive (left panel) and negative (right panel) V2 TG neurons in oxaliplatin-treated rats. (e) Summary data of the percent of KCNQ2-ir positive V2 TG neurons in control (open bar) and in oxaliplatin-treated group (closed bar). (f) Summary data of the percent of KCNQ2-ir positive neurons in all TG areas (V1 + V2 + V3) in control (open bar) and oxaliplatin-treated group (closed bar). Data in (e) and (f) represent Mean ± SEM, ***p < .001, compare with the data of control group.

