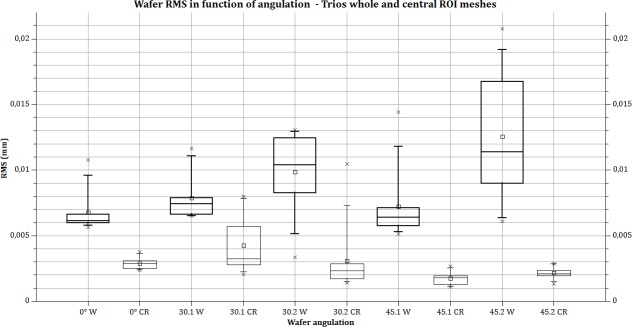
Fig 4. RMS calculated on wafer with CS3500.
Bold lines: the whole mesh is used for RMS calculation; thin line, RMS calculated in the central part of the mesh. Box plot: rectangle: 25% to 75%. Whiskers: 5–95 range. Square: mean value. Cross: min and max value. X axis: parameter acquisition (angulation and direction 1 or 2) and calculated area (W = whole mesh; CR = central region of mesh).

