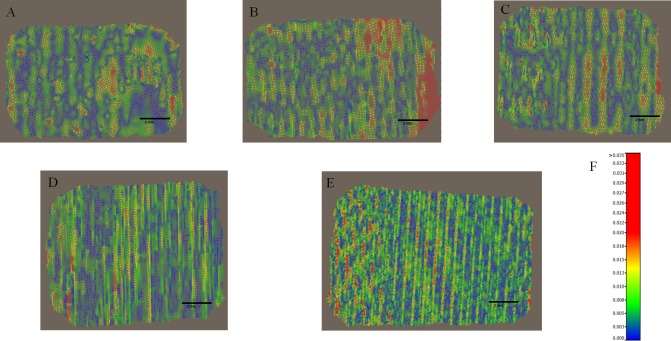
Fig 6. Examples of colour-mapped whole meshes imaged with a Carestream CS3500 intra-oral scanner.
Distances between the mesh and the average plane. The look-up table (LUT) shows the different colours as a function of distance to the vertices. Examples of coloured map meshes of the wafer recorded with an intra-oral scanner. (A) angulation 0°. (B) angulation 30° direction 1. (C) angulation 30° direction 2. (D) angulation 45° direction 1. (E) angulation 45° direction 2. (F) look-up table corresponding to distance/colour hue.

