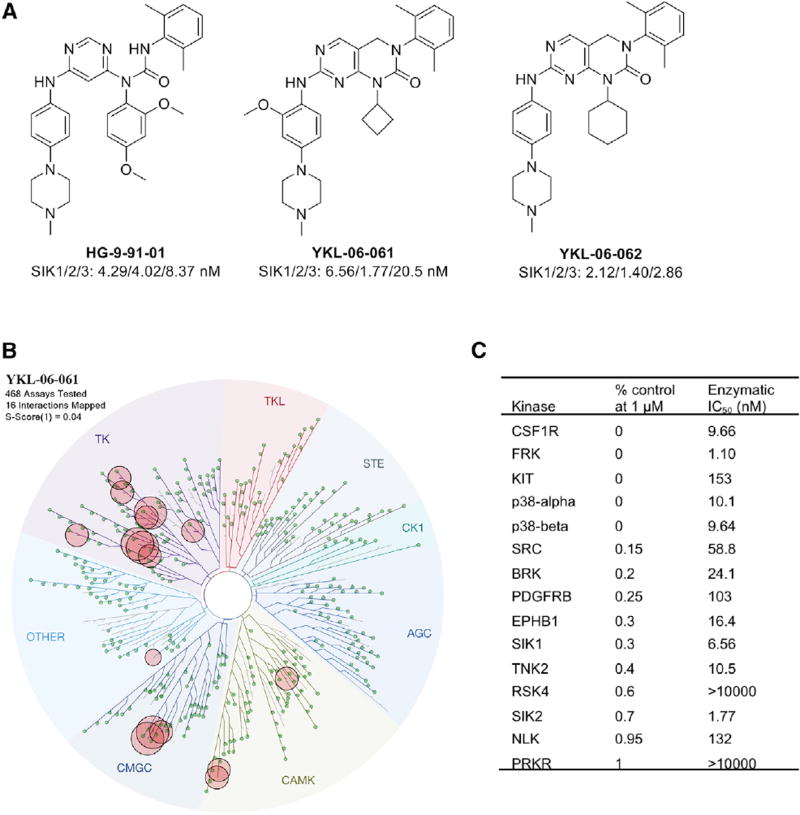
Figure 3. Characterization of SIK Inhibitors.
(A) Structures of HG-9-91-01, YKL-06-061, and YKL-06-062 and their biochemical IC50s against SIKs.
(B) KinomeScan kinase selectivity profile for YKL-06-061. YKL-06-061 was profiled at a concentration of 1 µM against a diverse panel of 468 kinases by DiscoverX. Kinases that exhibited a score of 1 or below are marked in red circles. (Score is percent relative to DMSO control. Smaller numbers indicate stronger binding.) See Table S1 for full kinome profile.
(C) Biochemical kinase IC50s of YKL-06-061 top hits as shown in (B).
TK, tyrosine kinase; TKL, tyrosine kinase-like; STE, homologs of yeast sterile 7, sterile 11, sterile 20 kinases; CK1, casein kinase 1; AGC, containing PKA, PKG, and PKC families; CAMK, calcium/ calmodulin-dependent protein kinase; CMGC, containing CDK, MAPK, GSK3, and CLK families. See also Table S1.

