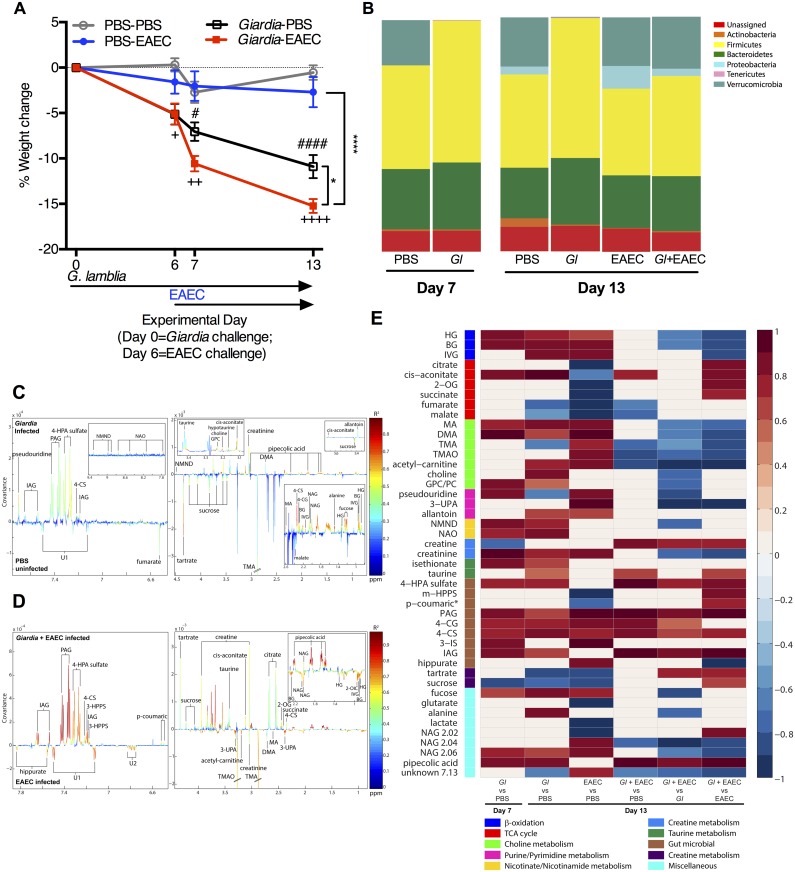
Fig 4. EAEC combines with Giardia to enhance microbial host co-metabolic perturbations and co-infection exhausts regulatory host energy expenditure adaptations during malnutrition.
C57Bl/6 males were initiated on the protein deficient diet upon arrival at 3 weeks of age and then challenged with G. lamblia 7 days later. Six days after G. lamblia, two groups were challenged with enteroaggregative E. coli (EAEC). Uninfected controls received PBS-PBS sham gavages at each infection timepoint. (n = 6/group). (A) Depicted is growth as percentage of starting weight beginning on the day of G. lamblia infection (Experimental day 0 (Day 0)) and through 13 days after Giardia challenge (7 days after EAEC challenge) (Day 13). (+P<0.05, ++P<0.01, ++++P<0.001 Giardia-PBS vs PBS-PBS; #P<0.05, ####P<0.001 Giardia-PBS vs PBS-EAEC; *P<0.05 Giardia-EAEC vs. Giardia-PBS Day 7 and Day 13; ****P<0.0001 Giardia-EAEC vs. PBS-EAEC Day 7 and Day 13). (B) Phylum-level relative operational taxonomic unit (OTU) abundances determined after amplification and sequencing of the V3-V4 region of 16S rRNA gene in fecal samples from uninfected, Giardia-infected, EAEC-infected, and co-infected mice on experimental days 7 and 13 as indicated. (C,D) OPLS-DA correlation coefficient plots indicating the variation between (C) Giardia infected (Day 13) and uninfected PBS controls (Day 13) (Q2Y = 0.40; P = 0.02) or (D) co-infection (Day 13) versus EAEC mono-infection (Day 13) (Q2Y = 0.82; p = 0.001) (n = 4-5/group). Correlation coefficients plots were generated with the use of a back-scaling transformation to display the contribution of each metabolite to the sample classification. Positive peaks indicate metabolites that were excreted in greater amounts in the Giardia infected (C) or co-infected (D) mice, and negative peaks indicate metabolites that were excreted in lower amounts. The color scale represents the significance of the correlation for each metabolite to the class membership with red indicating stronger significance and blue indicating weaker significance. (E) Heat map of significant changes in urinary metabolites measured using 1H NMR spectroscopy associated with OPLS-DA models. Represented as correlation coefficients (R) (red = increased; blue = decreased) in G. lamblia (Gl) infection at Day 7 and Day 13 versus age-matched uninfected (PBS) controls, EAEC mono-infection Day 13 versus age-matched uninfected (PBS) controls, or co-infection (Gl+EAEC) Day 13 compared with age-matched uninfected controls (PBS) or either mono-infection alone. Abbreviations: 2-OG, 2-oxoglutarate; 3-IS, 3-indoxylsulfate; 3-UPA, 3-ureidopropionic acid; 4-HPA, 4-hydroxyphenylacete; 4-CG, 4-cresolglucuronide; 4-CS 4-cresyl sulfate; DMA, dimethylamine; BG, butyrylglycine; GPC, α-glycerophosphocholine; HG, hexanoylglycine; IAG, indole acetyl gulconate; IVG, isovalarylglycine; MA, methylamine; m-HPPS, m-hydroxyphenylpropionylsulfate; NAG, N-acetyl glutamine; NAO, nicotinamide-N-oxide; NMND, N-methyl- nicotinamide; PAG, N-phenylacetylglycine; TMA, trimethylamine; TMAO, trimethylamine-N-oxide; UK, unknown.

