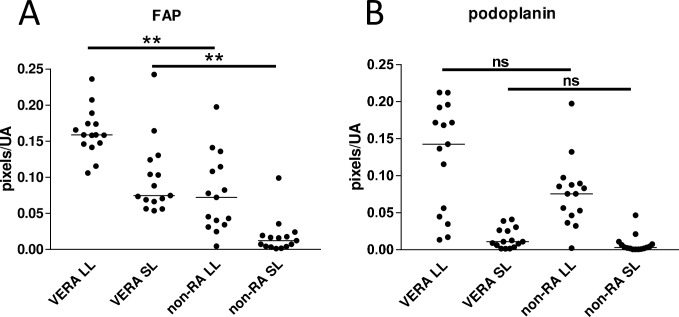
Fig 3. Differences in lining and sublining layer staining patterns of stromal markers with disease.
Expression of (A) FAP and (B) podoplanin quantified in lining and sublining layer regions in 15 sections from each group. FAP: Kruskal-Wallis p<0.0001, podoplanin p<0.0001; asterisks denote the results of Dunn’s post-test, **p<0.01).

