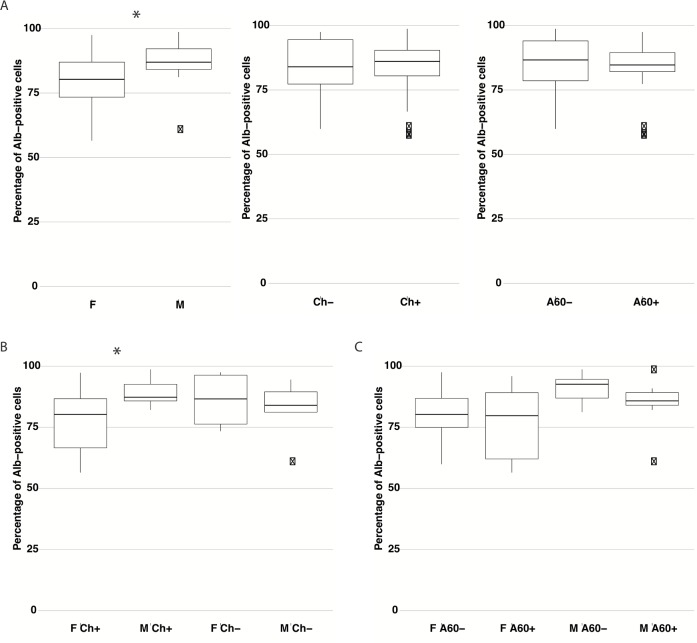
Fig 4. The impact of sex, chemotherapy, and age on the percentage of Alb-positive cells in P2 population.
Comparison of the percentage of Alb-positive cells in the P2 population between groups of patients. (A) F (n = 17), M (n = 18); Ch- (n = 9), CH+ (n = 26); A60- (n = 18), A60+ (n = 17). (B) F Ch+ (n = 13), M Ch+ (n = 13), F Ch- (n = 4), M Ch- (n = 5). (C) F A60- (n = 11), F A60+ (n = 6), M A60- (n = 7), M A60+ (n = 11). The differences between two independent groups were analyzed using the Welch's two-sample t-test. For multiple comparisons the Benjamini & Hochberg correction procedure was applied. In multivariate analysis the two-way Analysis of Variance (ANOVA) for linear model with interaction term was used. ANOVA results were subsequently confirmed using the Tukey HSD test. The results are presented as the median values with the range for each variable. * p < 0.05 Abbr.: Alb, albumin; F, female; M, male; Ch-, non-treated patients; Ch+, patients after chemotherapy; A60-, patients under 60 years old; A60+, patients 60 years old and older.

