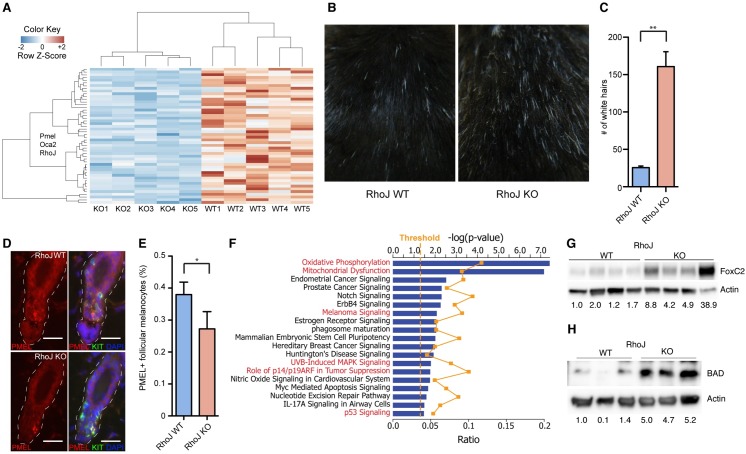
Fig 2. RhoJ modulates various signaling pathways to promote tumor growth.
(A) Heat map plot of 50 modulated genes upon loss of RhoJ. Hierarchical clustering of RNA-seq normalized read counts ranging from less frequently expressed (dark blue) to overexpressed (dark red) genes. (B) RhoJ KO mice have a greater number of white hairs than RhoJ WT mice. Images of 8-month old mice show that loss of RhoJ induces accumulation of white hairs. (C) The number of white hairs over an area of 1 in2 were counted and quantified using ImageJ (**p = 0.002, Student’s t-test). Error bars indicate SEM. (D) Loss of RhoJ results in fewer PMEL17+ follicular melanocyte stem cells. Double labeling for the melanosome protein PMEL17 (red) in hair follicle melanocyte stem cells (KIT+, green) at telogen demonstrates a noticeable reduction in the intensity and extent of PMEL expression in RhoJ KO mice. White dashed line indicates the extent of the hair follicle. Scale bars: 10μm (E) Quantification of the immunolabeling described in D demonstrates a statistically significant difference between RhoJ WT and RhoJ KO hairs (*p = 0.03, Student’s t test). Error bars indicate standard deviation of the mean. (F) RhoJ regulates oxidative phosphorylation, melanocyte differentiation, and MAP kinase signaling. Based on the differentially expressed genes between melanoma tumors from RhoJWT and RhoJKO mice, Ingenuity Pathway Analysis (IPA) generated an enrichment of canonical pathways regulated by RhoJ based on the literature (pathways potentially regulated by BRAF are highlighted in red). Bars indicate the negative logarithm of the enrichment p-value. The orange dotted line indicated the statistical threshold (p<0.05) for the enrichment canonical pathways. The orange squares indicate the ratio (value of molecules in a given pathway that meet the cutoff criteria, divided by total number of molecules that make up that pathway) for each canonical pathway. (G) FoxC2 is up regulated in mouse tumor samples. Melanoma tumor lysates were prepared for western blot and probed for the indicated Abs. Relative densitometry values are shown below each blot. (H) BAD is up regulated in RhoJ KO mouse tumor samples. Melanoma tumor lysates were prepared for western blot and probed for the indicated Abs. Relative densitometry values are shown below each blot.

