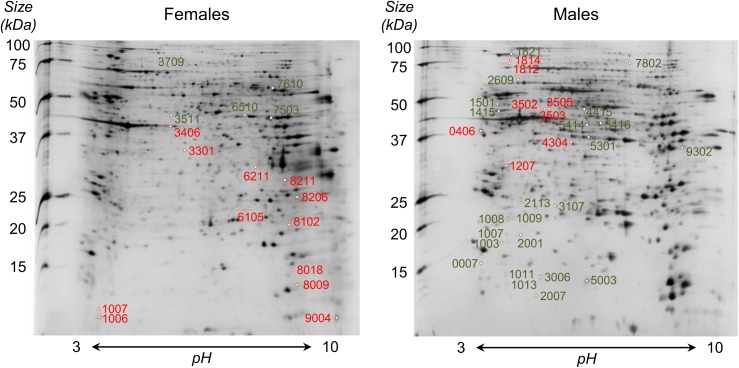
Fig 5. 2D gels of adult females (left) and males (right) of Schistosoma mansoni.
For each sex, spots over-expressed in latex-exposed group as compared to control group are indicated in red while under-expressed ones are represented in green. Protein identification of spots by MS/MS is available in S3 Table.

