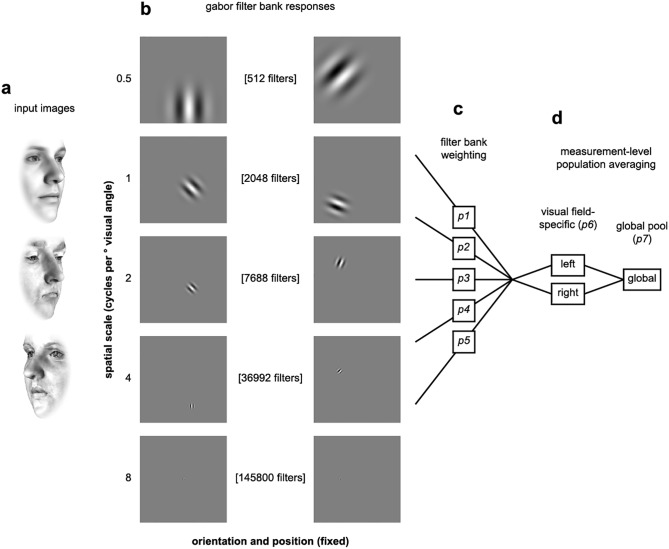
Fig 4. Schematic illustration of processing stages for the Gabor filter model.
(a) The model receives gray-scale image intensities for each face exemplar. Three examples input images are illustrated in rows. (b) Image intensities are passed through banks of Gabor filters. The banks vary in spatial scale (filter standard deviation and grid spacing). The rows illustrate example filters from each bank. (c) The output of each filter bank is weighted and measurement effects are modeled using subsequent hemifield-specific and global-pool population averaging stages (d). The final output of the model is a Euclidean distance matrix estimated from the activation vectors in response to each face.

