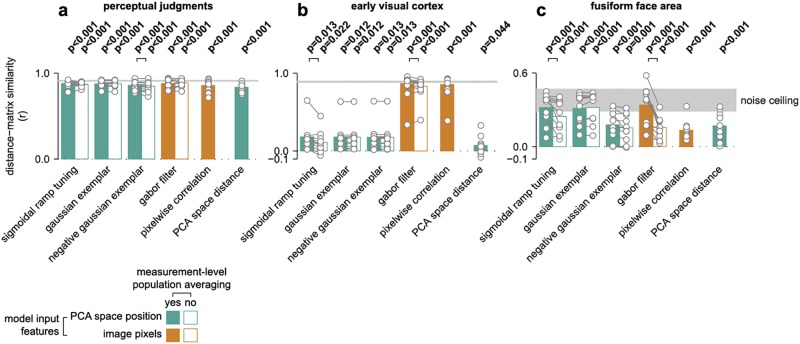
Fig 5. Generalization performance (leave-one-participant-out cross-validation) for fitted computational PCA-space (green bars) and image-based (orange bars) models, as well as mean performance for two fixed predictors (final bars in each panel).
The bars provide group-averaged Pearson correlation coefficients, while individual participants are overlaid in gray markers. Filled bars indicate full model fits, while outlined bars indicate model fits excluding measurement-level population averaging. Statistically significant differences between model variants with and without population averaging are illustrated with black connection lines (p<0.05, see S4 Table for all pairwise comparisons). An estimate of the maximal performance expected given signal-to-noise levels in the sample is illustrated as a shaded noise ceiling (Materials and methods). Performance is plotted in separate panels for perceptual judgments (a), early visual cortex (b), and the fusiform face area (c). For other regions of interest, see S5 Fig.

