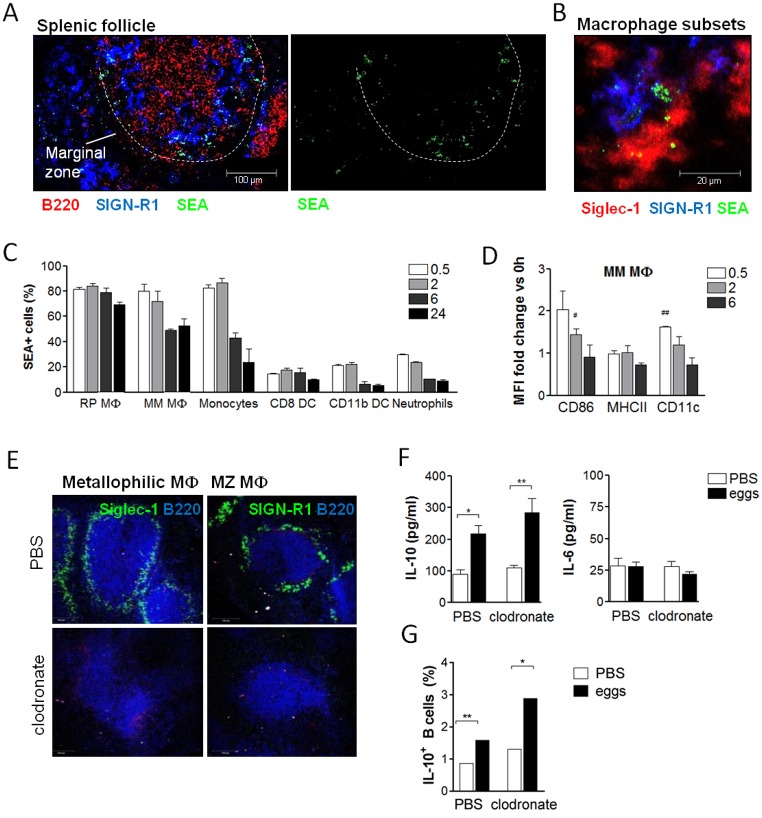
Fig 3. Macrophage subsets of the MZ bind SEA but are dispensable for schistosome antigen-mediated Breg cell induction.
(A, B) Spleens were snap-frozen 30 minutes after i.v. injection of 200 μg fluorescently labeled SEA, and binding of SEA analyzed by fluorescence microscopy. Images are representative for 2 experiments with N = 5 mice and 3 follicles per section imaged. (A) SEA clustered around the marginal zone of the spleen (indicated by white dashed line). (B) SEA localized in the marginal zone to macrophages expressing Siglec-1 (marginal metallophilic macrophages) and SIGN-R1 (MZ). (C, D) Mice were i.v. injected with fluorescently labeled SEA and splenocytes harvested 30 minutes-24 hours later. (C) Frequency of SEA-positive cells in various splenocyte subsets as determined by flow cytometry (gating schemes see S4 Fig). MΦ, macrophages; RP, red pulp; MM, marginal metallophilic; DC, dendritic cells. (D) Mean fluorescence intensity of surface markers on MM macrophages calculated as fold increase versus the expression at time-point 0 hours. Summary of 2 experiments with N = 2. (E-G) Mice were i.p. injected with 200 μl clodronate-containing liposomes or PBS control liposomes. Three weeks later, mice were i.p. injected with two doses of 5000 eggs. Seven days after the last egg injection, splenic B cells were restimulated for 2 days with SEA. (E) Absence of splenic Siglec-1 and SIGN-R1-expressing macrophage subsets at the time-point of spleen collection was confirmed by fluorescence microscopy. B cells were stained with B220. (F) Cytokine concentration in culture supernatants as determined by ELISA. (G) Intracellular IL-10 expression of B cells after addition of Brefeldin A to the last 4 hours of the culture. One representative (N = 5) out of 2 similar experiments is shown. Significant difference by Mann-Whitney test is indicated with * p < 0.05, ** p < 0.01. Significance as determined by one-sample t-test of log-transformed data is indicated with # p < 0.05, ## p < 0.01.

