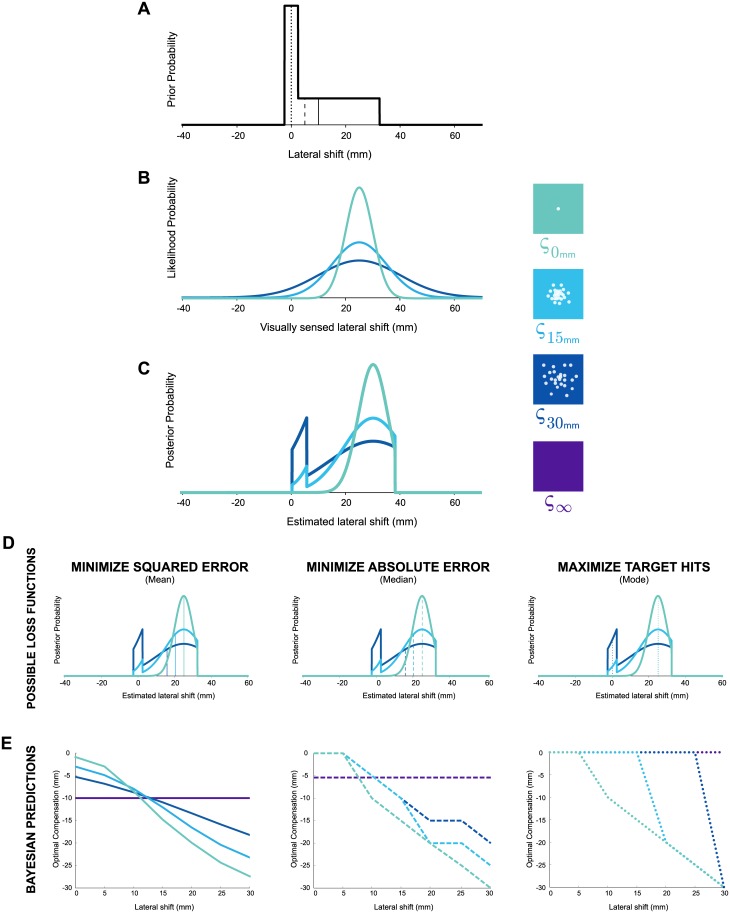
Fig 2.
Experiment 1: By multiplying A) the probability of a lateral shift (prior probability) with B) the visually sensed lateral shift (likelihood probability) we obtain C) an estimate of the lateral shift (posterior probability) given current evidence and previous experience. The different colors in B-E represent the different amounts of visual uncertainty (ς0mm = single dot; ς15mm = medium cloud of dots; ς30mm = large cloud of dots; or ς∞ = feedback withheld). For a lateral shift of 22.5mm, D) shows the optimal compensation for three different loss functions that either: i) minimize squared error, ii) minimize absolute error, or iii) maximize target hits, which is found by taking the mean (solid vertical line), median (dashed vertical line), or mode (dotted line) of a posterior, respectively. Differences between these strategies become more apparent with greater visual uncertainty. E) Optimal compensation for any lateral shift, given some level of visual uncertainty and a particular loss function. Note that the optimal compensation is equal to but in the opposite direction of the estimated lateral shift, representing a movement that counteracts a given lateral shift.

