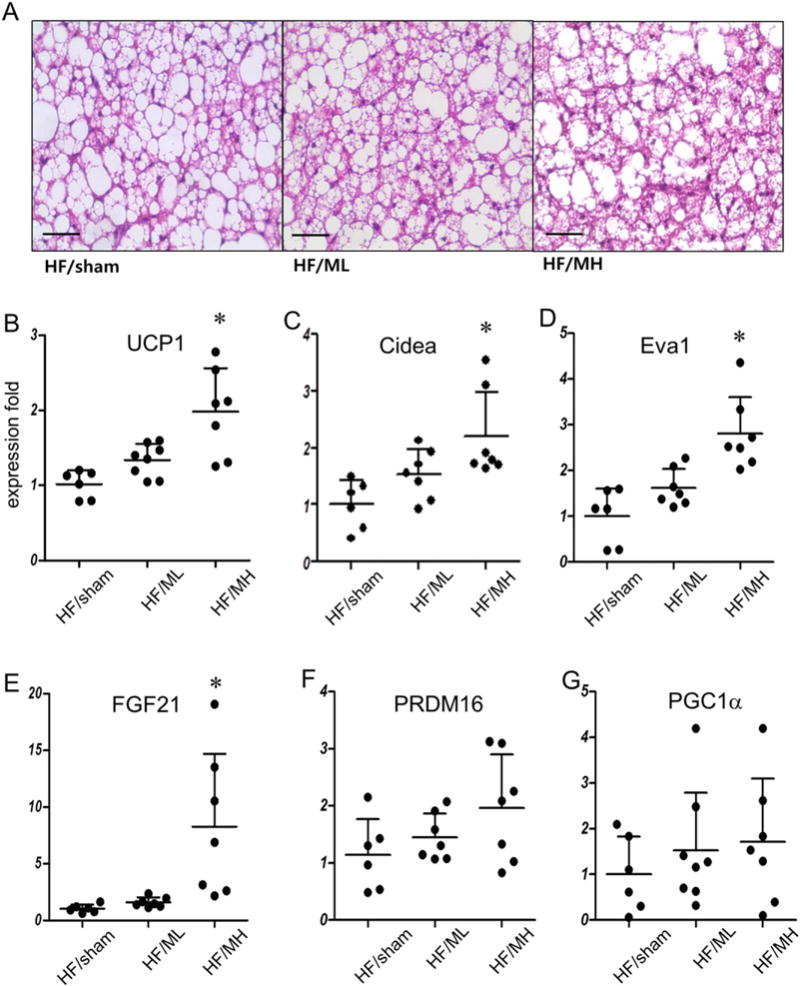
Fig. 4.

MB109 enhances expression of UCP1 and FGF21 in the BAT. (A) Representative H&E staining of the BATs of animals with average body weights in each group (magnification 400×). Scale bars indicate 50 μm. (B) UCP1 mRNA expression levels in the BATs were analyzed using real-time PCR as described in Fig. 2. Eva1 (C), FGF21 (D), PRDM16 (E), and PGC1a (F) mRNA expression levels in the BATs were analyzed as described in Fig. 2.
