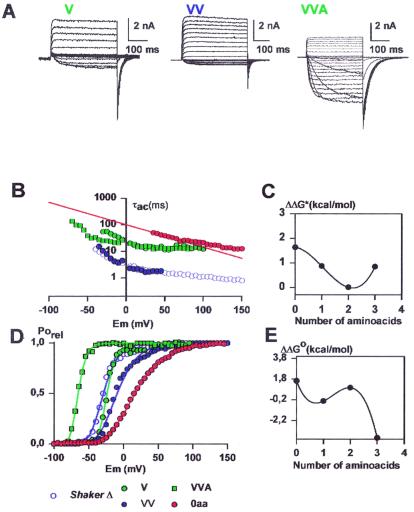
Figure 3.
(A) Functional expression of deletion mutants at the amino terminal end of the S3–S4 linker. The holding potential was −100 mV and the membrane was pulsed to voltages between −70 mV to 125 mV in 10-mV increments followed by a step to −60 mV for the V and VV mutants. For the holding voltage of VVA mutant was −100 mV, and the membrane was pulsed between −100 mV and 125 mV in 10-mV increments followed by a step to −100 mV. (B) Voltage dependence of the activation kinetics of the deletion mutants shown in A. Time constants were determined as described in Methods. V, green diamonds; VV, blue triangles; VVA, green squares. For comparison the results for 0 aa (red circles) and the ShakerΔ (blue circles) are shown. (C) Changes in activation free energy of the rate limiting step of channel opening at 0 mV (ΔΔG*) induced by deletions in the S3–S4 linker region. ΔΔG* was calculated as described in Results. Activation time constant data were obtained from Table 1. (D) Voltage-activation curves in deletion mutants at the amino-terminal end of the S3–S4 Linker. Symbols as in A. Each point is the average of determinations on 5–10 separate patches. Solid lines were drawn by using the parameters in Table 1 and Eq. 5. (E) Distribution of free energy perturbations (ΔΔGo) in channel activation. Changes in activation free energy ΔΔGo caused by each mutant were calculated from V1/2 and zδ as described in Methods. For more details see legend of Fig. 2.

