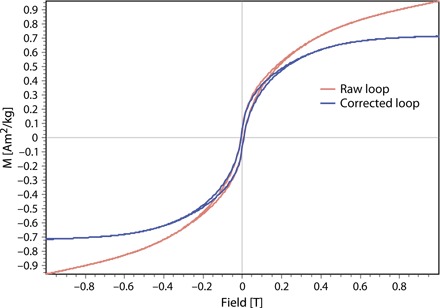
Fig. 2. Hysteresis curves for 15498.

The red curve shows the measured data. The blue curve shows the data after application of a paramagnetic slope correction.

The red curve shows the measured data. The blue curve shows the data after application of a paramagnetic slope correction.