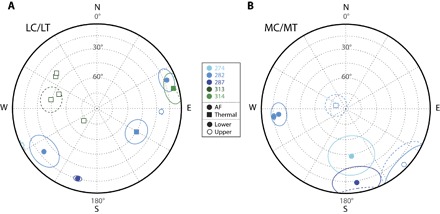
Fig. 5. Equal-area stereographic projections of LC/LT and MC/MT magnetization components observed for interior subsamples of 15498.

(A) LC (circles) and LT (squares) component directions. (B) MC (circles) and MT (squares) component directions. Lines encircling component directions represent the maximum angular deviations associated with each direction. Open symbols (dashed lines) represent directions in the upper hemisphere, whereas filled symbols (solid lines) represent directions in the lower hemisphere. Subsamples from parent chips 274, 282, 287, 313, and 314 are denoted with light blue, medium blue, dark blue, dark green, and light green symbols, respectively.
