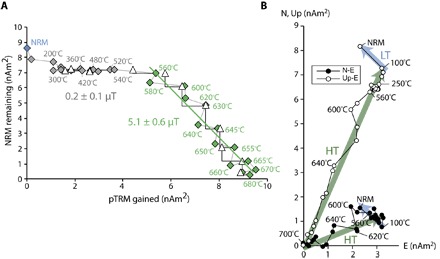
Fig. 7. Thellier-Thellier paleointensity experiment for subsample 15498,313e.

(A) Arai plot displaying NRM lost during progressive thermal demagnetization (ordinate) versus laboratory pTRM gained (abscissa). Peak temperatures for selected steps are shown. pTRM checks for alteration are shown as triangles. Paleointensities for unblocking temperature ranges of 250° to 540°C and 560° to 680°C are denoted with dark gray and green symbols, respectively. Gray segments link consecutive thermal steps. (B) Vector endpoint diagram showing zero-field thermal demagnetization steps for subsample 313e. LT and HT components are denoted using blue and green symbols, respectively. Paleointensity experiments were conducted following the IZZI protocol (alternating zero-field and in-field measurements).
