
Fig. 2. Detailed structural features of the OM anchoring RI.
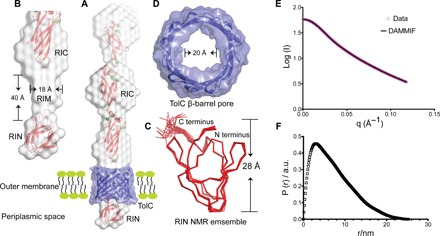
(A) The NMR structure of RIN (bottom) and the 2 Å crystal structure of RIC (top) are colored red and fitted into the gray solution structure of the whole RI construct determined by SAXS. The RI solution envelope is fitted through the purple TolC pore homology model embedded in the OM. (B) Close-up view of the cylindrical RIM (gray) determined by SAXS without showing the TolC pore. Dimensions of RIM are indicated. (C) Top-down view of the TolC OM pore model. The internal diameter is indicated. (D) The 20-member NMR structural ensemble of RIN is colored red and shown in ribbon representation. The N and C termini and the height of the protein are marked. (E and F) SAXS data were collected from MpIBP_RI at a concentration of 7 mg/ml. (E) Experimental scattering data of MpIBP_RI (magenta symbols) and fit result of ab initio modeling (DAMMIF, black line). (F) Radial distribution function obtained after Indirect Fourier Transform (IFT) analysis of the scattering data, with data points starting from the first Guinier regime at low q up to the Porod regime at high q values (0.013 Å−1 ≤ q ≤ 0.12 Å−1). a.u., arbitrary units.