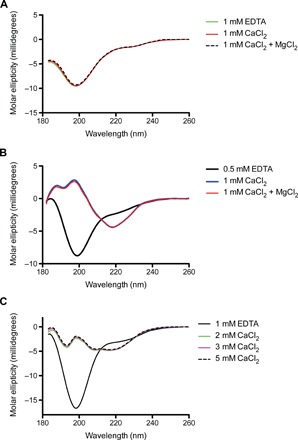
Fig. 3. CD spectra of RINM, RIII_5, and RV measured in EDTA and different concentrations of CaCl2 or MgCl2.

(A) The far-UV CD spectra of RINM were plotted as molar ellipticity versus wavelength. The spectra in the presence of 1 mM EDTA (green line), 1 mM CaCl2 (red line), and both 1 mM CaCl2 and MgCl2 (broken black line) are coincident. (B) The far-UV CD spectra of RIII_5. Spectra in the presence of 0.5 mM EDTA, 1 mM CaCl2, and both 1 mM CaCl2 and MgCl2 are indicated by black, blue, and red lines, respectively. (C) The far-UV CD spectra of RV. Spectra in the presence of 1 mM EDTA or 2, 3, and 5 mM CaCl2 are indicated by black, green, magenta, and broken black lines, respectively.
