
Fig. 8. Model of M. primoryensis collectively binding with diatoms to ice.
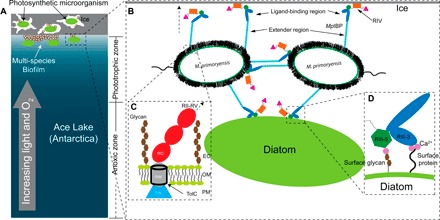
(A) Ice/snow that covers the surface of Ace Lake to a depth of 1 to 2 m is represented by a gray rectangle with three internal brine channels of irregular shape. Lake water is colored blue with a light to dark gradient from top to bottom signifying the increased availability of light and oxygen toward the top of the water column as indicated by the gray arrow. Bacteria and photosynthetic microorganisms such as diatoms within the brine pits and underneath the ice are drawn as small white ovals and large green ovals, respectively. The phototrophic and anoxic zones are indicated on the right. (B) Expanded view of (A) showing two linked bacterial cells bound to ice and a diatom. Cell-surface proteins and carbohydrates are drawn as fuzzy black hairs, and the polar flagella are drawn as squiggles. MpIBPs protrude from cell surfaces. RII, RIII_1–4, RIII_5, RIV, and RV are drawn as cyan rods, blue ovals, dark green hexagons, orange rectangles, and magenta triangles, respectively. (C) Expanded view of the cell surface–anchoring domains of MpIBP near the OM. OM is drawn the same way as in Fig. 2A. Surface glycans are drawn as connected brown hexagons. RIN, RIM, and RIC are drawn as a blue triangle, a gray cylinder, and red ovals, respectively. The hollow TolC OM pore is outlined in black. The arrow with a broken line indicates the protein continues to RII to RV. (D) Enlarged view of MpIBP_RIII interacting with the peptide and sugar molecules on the cell surface of a diatom. Ligand-binding Ca2+ are drawn as magenta spheres. Surface protein is indicated by a wavy line from the cell surface.