. 2017 Aug 9;6:e28440. doi: 10.7554/eLife.28440

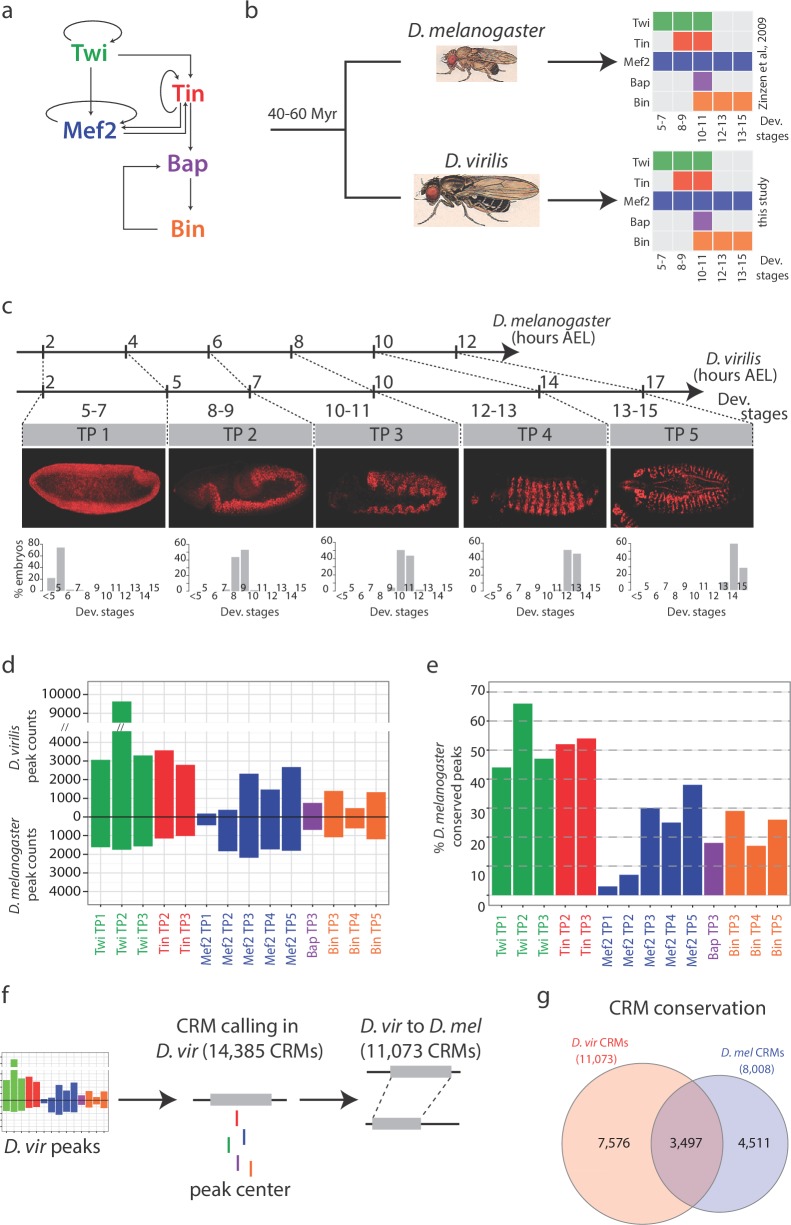
Figure 1. Conservation in TF occupancy across developmental and evolutionary time-scales.

(a) The regulatory network linking 5 mesodermal transcription factors essential for mesoderm specification. (b) D. melanogaster and D. virilis ChIP were performed using species-specific antibodies for Twi, Tin, Bap and Bin. Colored boxes illustrate TFs and time points analyzed, with developmental stages on the x-axis. (c) The scale illustrates equivalent time points for corresponding stages between D. melanogaster and D. virilis. Axis labels correspond to hours of development, after egg laying (AEL) and numbers below axis correspond to developmental stages and Time Points (TP 1–5). Confocal images of embryos with Mef2 immuno-stains at the most representative stage for each time-point, orientated anterior-left, dorsal-up. Barplots show percentage of embryos at each stage (x-axis) for each TP, averaged over two replicates. (d) Number of significant ChIP peaks in each condition in both species. TP1, TP2, etc, correspond to Time point 1, Time point 2 etc. D. melanogaster peaks are from (Zinzen et al., 2009). (e) Percentage of conserved peaks between D. melanogaster and D. virilis. (f) Peak summits in close proximity were used to define cis-regulatory modules (CRMs, see Materials and methods). (g) Venn diagram of orthologous CRMs conserved between both species; 3,497 CRMs (D. mel CRMs overlapping more than one D. vir CRMs are counted once).

DOI: http://dx.doi.org/10.7554/eLife.28440.002

Figure 1.

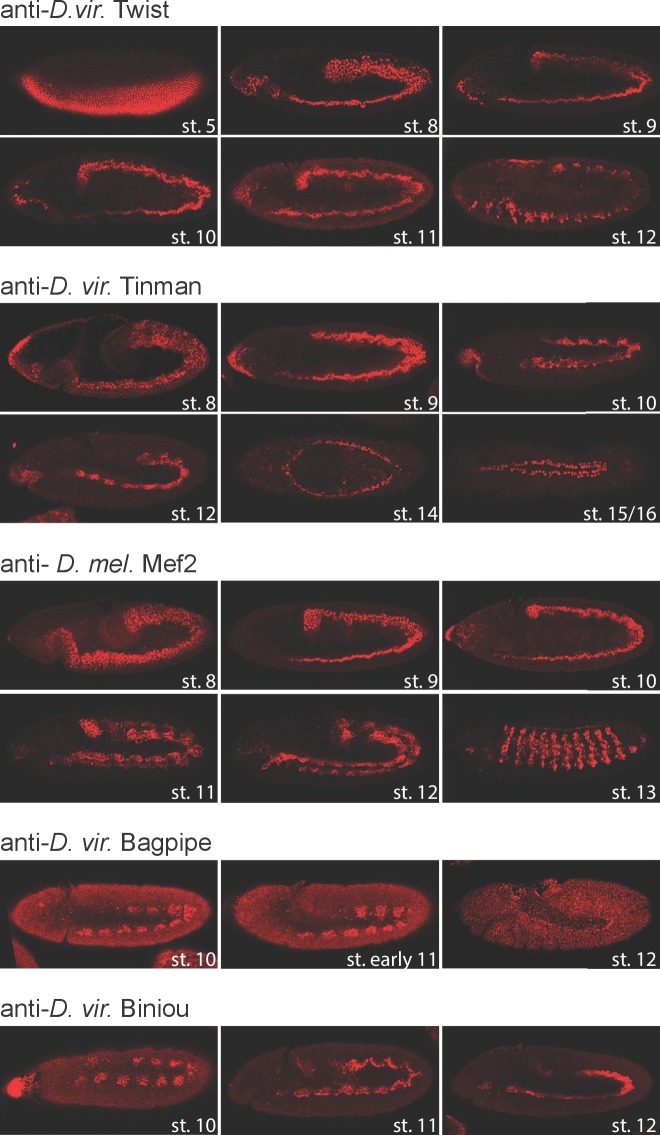
Figure 1—figure supplement 1. TF expression pattern in D. virilis embryos.

Figure 1—figure supplement 1.

Fluorescent immunostaining of D. virilis embryos at the indicated stages using the same antibodies used for ChIP-seq experiments. With the exception of Mef2, all antibodies were generated specifically for this study directed against the D. virilis protein: anti-Dmel Mef2 (DRE5, second bleed), anti-Dvir for Twi (DNOH, third bleed), Tin (EJRI, third bleed), Bap (EJSJ, second bleed) and Bin (EHUD, third bleed). Developmental stages are shown in white. All embryos are oriented anterior-left.

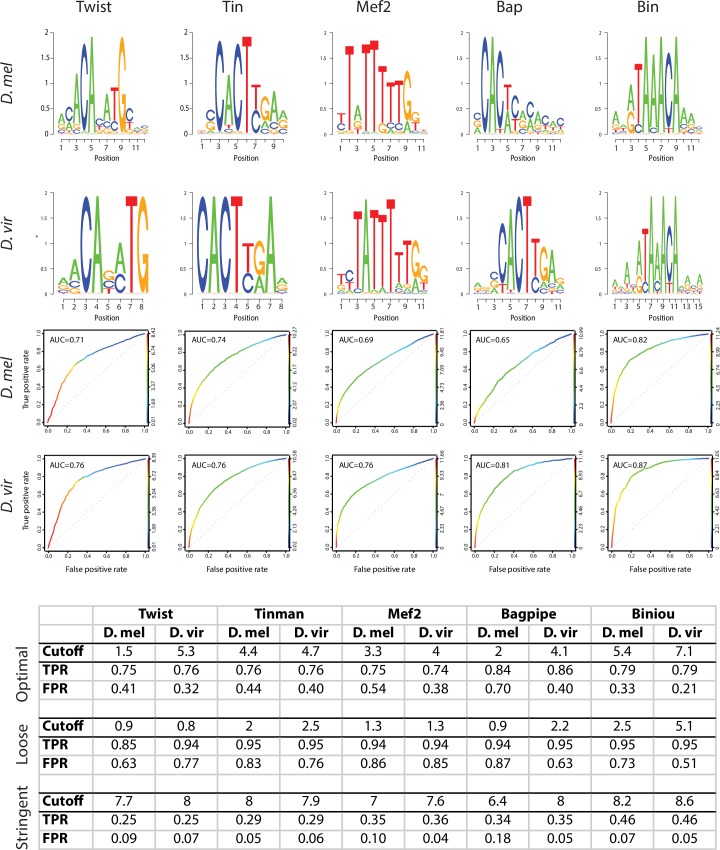
Figure 1—figure supplement 2. PWMs of orthologous transcription factors are highly similar.

Figure 1—figure supplement 2.

For each TF, D. melanogaster and D. virilis position weight matrices (PWMs) are shown in the form of sequence logos (upper panels). ROC plots represent true positive and false positive rates gained from the whole range of Patser scores (0 and higher, ROC curve color) (Hertz and Stormo, 1999). Table represents True Positive Rate (TPR) and False Positive Rate (FPR) obtained at different cutoffs for the 5 transcription factors. Equivalent Patser thresholds used for TFBS definition (bottom table) were determined as (1) the Patser score giving a TPR of 70–80% and a FPR of 40% maximum on the best performing organism (as evaluated by the ROC) and (2) the Patser score giving the same TPR for the other organism.