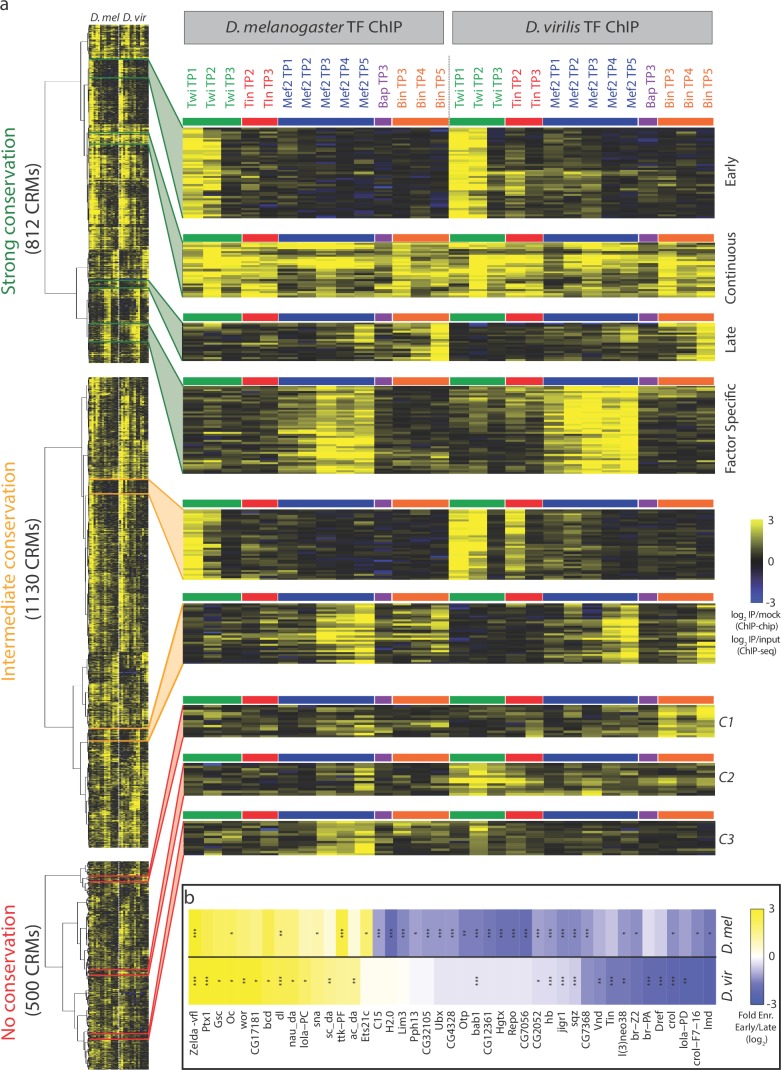
Figure 3. Dynamic patterns of developmental enhancer occupancy across distantly related species.
(a) Hierarchical clustering of ChIP signal of CRMs with high, intermediate and low binding conservation, as classified using Jaccard distance (Figure 2). Each row corresponds to an orthologous CRM, and each column to a condition, with 14 D. melanogaster conditions followed by their equivalent 14 D. virilis conditions. The vertical dashed line delimits data from both species, while the horizontal colored bars indicate the TF. All three heatmaps are visualized using the quantitative ChIP-signal shown in the scale in lower right. (b) Differential motif analysis on early vs late Twi bound enhancers indicates that the regulation of these elements is largely conserved. Heatmap shows fold enrichment (early vs late bound enhancers, log2) of all motifs with >2 fold significant enrichment in one of the two species. *p<0.05; **p<0.01; ***p<0.001 indicates significance in that species. Color indicates motif enrichment, which is generally in the same direction in both species, even when significant in only one species.


