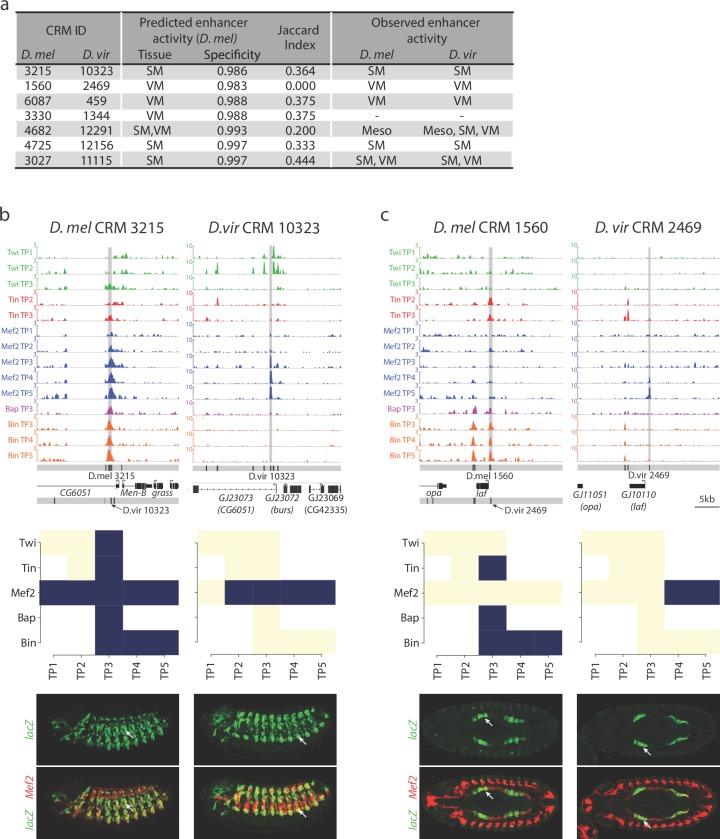
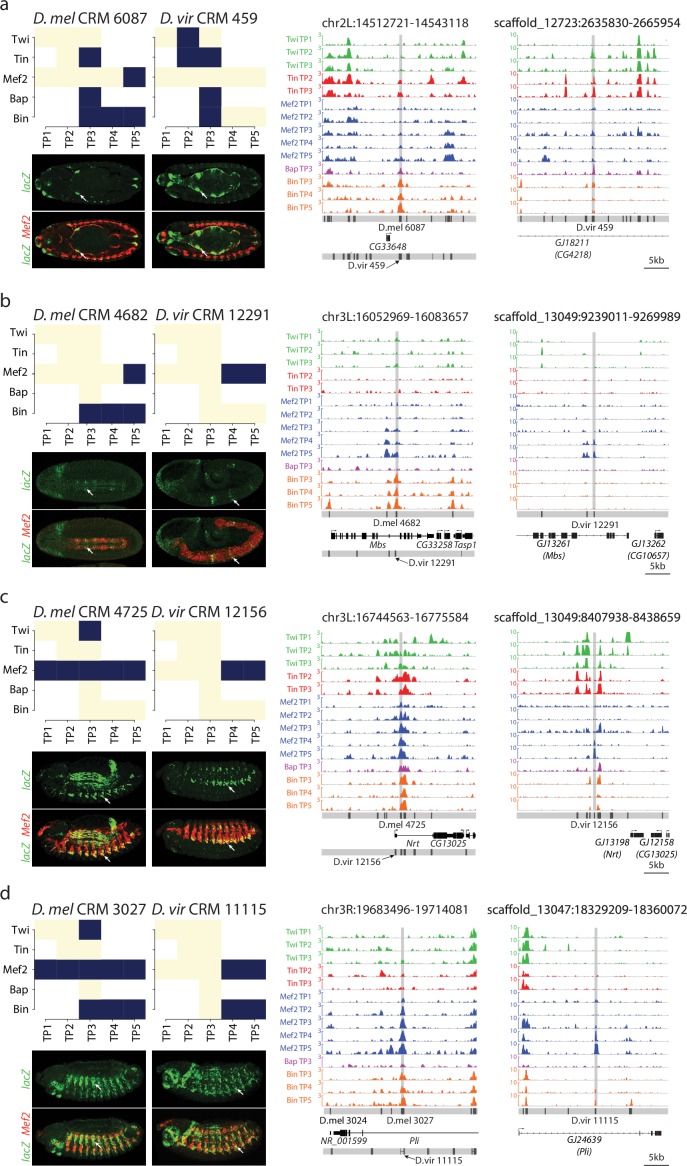
Figure 6. Relationship between divergence in TF occupancy and enhancer activity.
(a) Table summarizing the orthologous D. melanogaster (D. mel) and D. virilis (D. vir) CRMs tested for in-vivo activity in D. mel embryos. The enhancer’s predicted tissue activity, and SVM specificity score, for the D. mel enhancer is indicated (from Zinzen et al., 2009). The observed enhancer activity for both the D. mel and orthologous D. vir enhancers are indicated. SM = somatic muscle, VM = visceral muscle, Meso = mesoderm. (b–c) Upper panel, TF occupancy (ChIP signal) of two orthologous CRM pairs representing the quantitative binding profiles along the 14 conditions in both species. D. mel data corresponds to log2(IP/mock) ChIP-chip signal. D. vir data corresponds to RPM normalized, input subtracted ChIP-Seq signal. In D. mel, both D. mel and translated D. vir CRMs are shown along with D. mel gene models. In D. vir, D. vir CRMs and D. mel orthologous gene models are shown. Middle panel shows TF binding logos, where blue represents significant ChIP peaks at the indicated time point (columns = Time Point (TP) and rows = factor). Lower panel shows double in-situ hybridization of transgenic embryos for each orthologous enhancer (lacZ reporter driven by the enhancer, green channel) and a mesodermal marker (Mef2, red). White arrow indicates the somatic muscle (b) and visceral muscle (c) of an embryo in a lateral or dorsal view, respectively.


