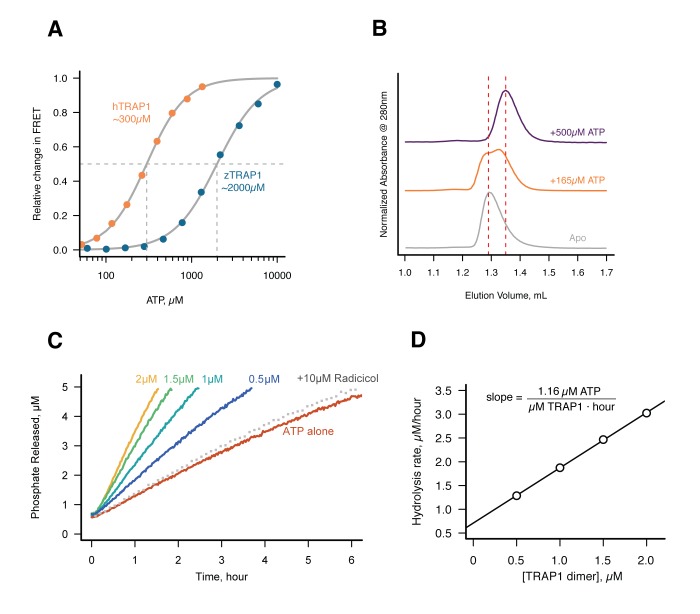
Figure 3. Without Mg2+hTRAP1 adopts the closed state and slowly hydrolyzes ATP in solution.
(A) Equilibrium titration of closure in response to ATP in presence of excess EDTA hTRAP1 (orange) and zTRAP1 (dark blue) using FRET. The indicated half-max concentrations are obtained from fits to the Hill equation (gray lines). (B) Size-exclusion chromatography of cysteine-free TRAP1 under apo (gray), and after 1.5 hr incubation at 30˚C with 165 µM ATP (partial closure, orange), and 500 µM ATP (full closure, purple). Red dashed lines are guides for apo and closed state peak positions. (C) Ultra sensitive assay of ATP hydrolysis using fluorescent phosphate-release assay with PBP-MDCC with ATP alone (red) and varying dimer concentrations of cysteine-free TRAP1, and 2 µM TRAP1 + 10 µM radicicol (gray dotted line). (D) Initial rates from phosphate-release kinetics plotted against TRAP1 dimer concentration confirming that the rate above baseline is TRAP1 dependent. The ATPase hydrolysis rate per TRAP1 dimer is 1.16 µM ATP· µM TRAP1−1 · hr−1.


