. 2017 Aug 9;6:e26640. doi: 10.7554/eLife.26640

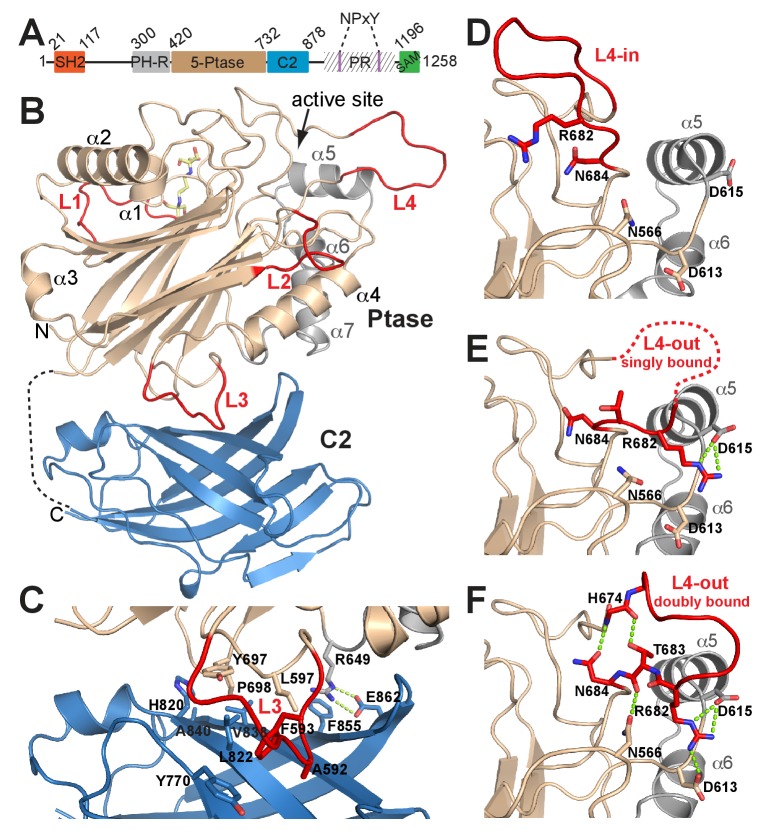
Figure 1. Structure of SHIP2 Ptase-C2.

(A) Schematic domain structure of human SHIP2. SH2, Src homology domain 2; PH-R, pleckstrin homology related domain; 5-Ptase, 5-phosphatase; PR, proline rich; SAM, sterile-α-motif. (B) Ribbon representation of SHIP2 Ptase-C2, molecule B. The 5-Ptase domain is colored in tan and gray with loops (L1–L4) in red and the C2 domain in blue. The disordered linker is shown as dashed line and the site of catalysis is marked (active site). (C) Close-up of the domain interface. (D–F) L4 can switch between ‘in’ and ‘out’ conformations. The L4-in conformation, with R682 pointing towards the active site is seen in two Ptase crystal structures (shown in panel D is PDB 3NR8, chain B). The L4-out conformation is only seen in Ptase-C2 WT crystal structures, where R682 is either singly bound to D615 (panel E, shown is molecule G) or doubly bound to D613 and D615 (panel F, shown is molecule B).

DOI: http://dx.doi.org/10.7554/eLife.26640.002

Figure 1.

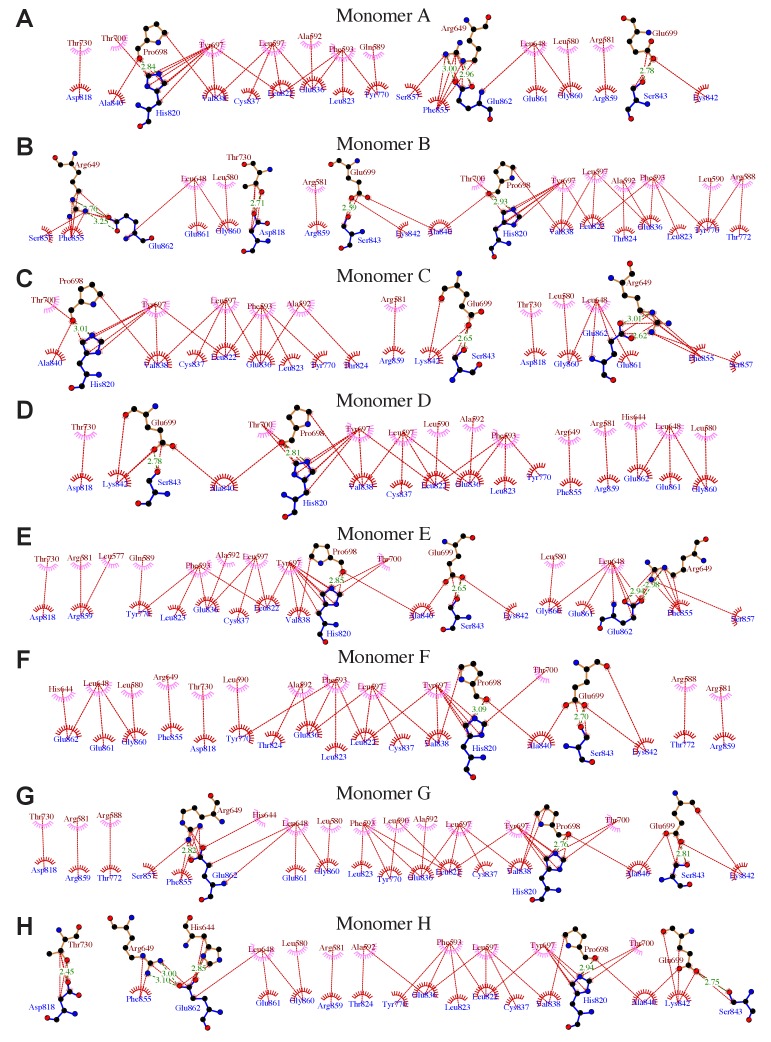
Figure 1—figure supplement 1. Details of interactions between the Ptase and C2 domains in Ptase-C2 WT.

Figure 1—figure supplement 1.

(A–H) Details of the interdomain interactions are shown for the 8 Ptase-C2 WT molecules A-H. Ptase residues are labeled in brown, C2 residues in blue. Hydrophobic interactions are indicated as red lines, hydrogen bonds as green dashed lines. Plots are generated using LigPlot (Wallace et al., 1995).

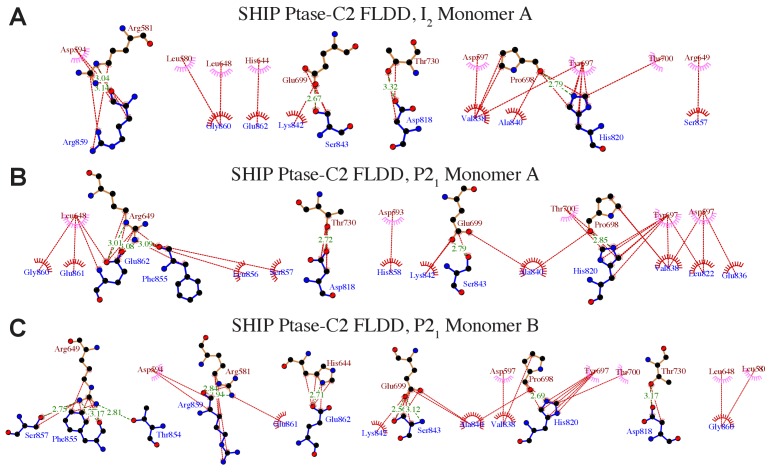
Figure 1—figure supplement 2. Details of interactions between the Ptase and C2 domains in Ptase-C2 FLDD.

Figure 1—figure supplement 2.

(A–C) Ptase-C2 interactions in the FLDD mutant. Details of the interdomain interactions are shown for the Ptase-C2 FLDD molecule in the I2 (A) and the two molecules in the P21 crystal form (B–C). Ptase residues are labeled in brown, C2 residues in blue. Hydrophobic interactions are indicated as red lines, hydrogen bonds as green dashed lines. Plots are generated using LigPlot (Wallace et al., 1995).