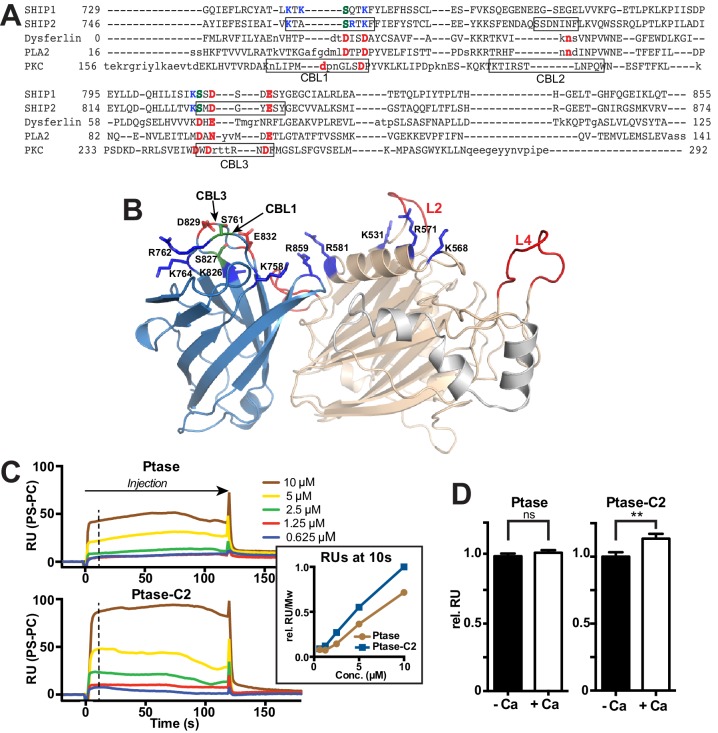
Figure 2. The C2 domain of SHIP2 and lipid binding.
(A) Structure-based sequence alignment of the C2 domains of SHIP2, dysferlin, phospholipase A2 (PLA2) and protein kinase Cα (PKCα) and alignment of the corresponding sequence of SHIP1. Structurally equivalent positions with the SHIP2 C2 domain are in uppercase, insertions relative to SHIP2 are in lowercase. Calcium-binding loops (CBL) 1–3 of PKCα and corresponding loops in SHIP2 are boxed. Conserved acidic Ca2+-binding residues and corresponding residues in SHIP are colored red, changes to serines are green and basic residues within or near the CBL’s in SHIP are colored blue. (B) Putative lipid interactions in the SHIP2 Ptase-C2 region. Conserved acidic residues on CBL3 of SHIP2 (D829 and E832) are colored red and changes to serines green (S761 on CBL1 and S827 on CBL3). Basic residues on the Ptase and C2 domains expected to face the membrane are colored blue. For the mentioned residues, side chains are shown in stick representation. (C) SHIP2 binding to phosphatidylserine (PS) by surface plasmon resonance (SPR). SHIP2 Ptase and Ptase-C2 interactions to PS were studied using vesicles immobilized on a L1 sensor chip. Displayed are sensorgrams showing the difference in response between the active flow cell coated with 30% (mol/mol) PS vesicles and the reference cell containing phosphatidylcholine (PC) vesicles. The horizontal arrow indicates the association phase of Ptase and Ptase-C2 proteins, and the time axis is set to zero at the beginning of the injection. Insert: The SPR response units (RU) at 10 s of injection (dashed line), where we consider the steady state phase to be reached, is plotted. Values are corrected for the molecular weight (Mw) and relative to the highest response for Ptase-C2 at 10 μM. (D) Calcium dependency of the SHIP2 PS interaction. SPR responses of Ptase and Ptase-C2 were recorded as in panel C, but in presence or absence of 0.5 mM CaCl2. Plotted are mean RUs relative to RUs in absence of Ca2+ from triplicate injections of 5 μM protein and error bars represent SEM. ns: p>0.05; **p<0.01 (unpaired Student t test). See also.
DOI: http://dx.doi.org/10.7554/eLife.26640.006
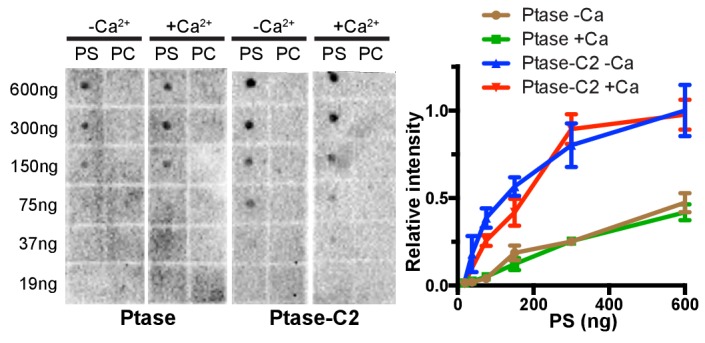
Figure 2—figure supplement 1. Lipid binding by protein lipid overlay.


