. 2017 Aug 9;6:e26640. doi: 10.7554/eLife.26640

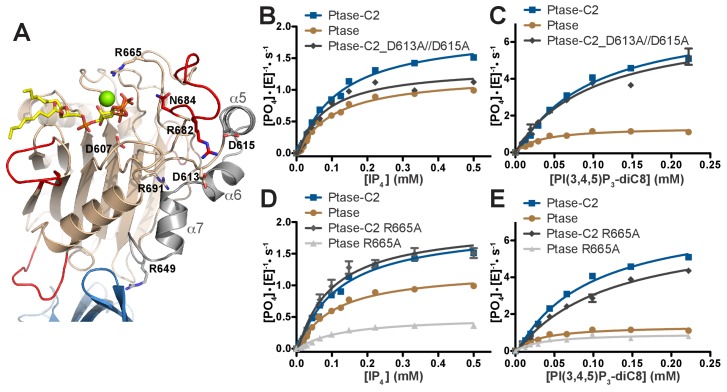
Figure 7. SHIP2 mutational analysis.

(A) Residues mutated in the SHIP2 Ptase domain are shown as sticks and are labeled. (B–E) For mutants that display significant activity (D613A/D615A and R665A), substrate titration curves are shown. The enzyme concentration used in the shown plots is 400 nM (with IP4) or 50 nM (with PI(3,4,5)P3-diC8). Curves are fitted using the Michaelis-Menten equation and derived kcat and KM values are shown in Table 3. Error bars represent SEM from at least three measurements.

DOI: http://dx.doi.org/10.7554/eLife.26640.024

Figure 7—source data 1. Source data for plots in Figure 7B–E.
Values are in [PO4]*[E]−1*s−1. The values in red were excluded. Numbers (#i) above data indicate independent experiment number. Equation used to fit data in Figure 3A–F: Y = Bo + Vm*X/(X + Km); Variables: Vmax, Km, Bo = baseline. Software used: Graphpad Prism.
DOI: 10.7554/eLife.26640.025

Figure 7.

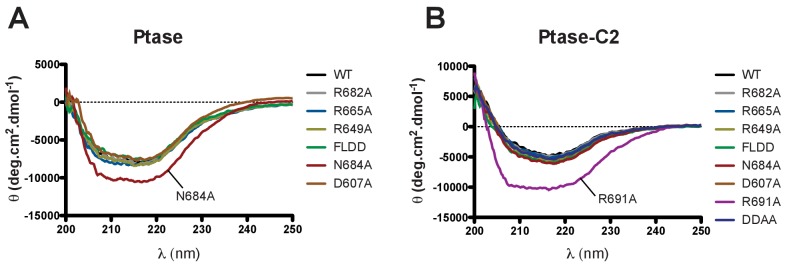
Figure 7—figure supplement 1. Circular dichroism analysis of purified SHIP proteins.

Figure 7—figure supplement 1.

(A–B) Far UV CD spectra of SHIP2 Ptase (A) and Ptase-C2 (B) are shown for WT and all purified mutants.