. 2017 Aug 9;6:e26640. doi: 10.7554/eLife.26640

Figure 8. SHIP2 cellular activity.

Full-length SHIP2 proteins were transiently expressed in HEK293 cells and resulting Akt-pT308 levels monitored. Shown are transfections of empty vector (-), wild type SHIP2 (WT), the FLDD mutant and C2 deleted SHIP2 (ΔC2). A typical blot is shown and quantifications of blots are averaged from eight independent experiments, each in triplicates (n = 24), with SEM’s indicated. *p<0.05; ****p<0.0001 (unpaired Student t test).

DOI: http://dx.doi.org/10.7554/eLife.26640.029
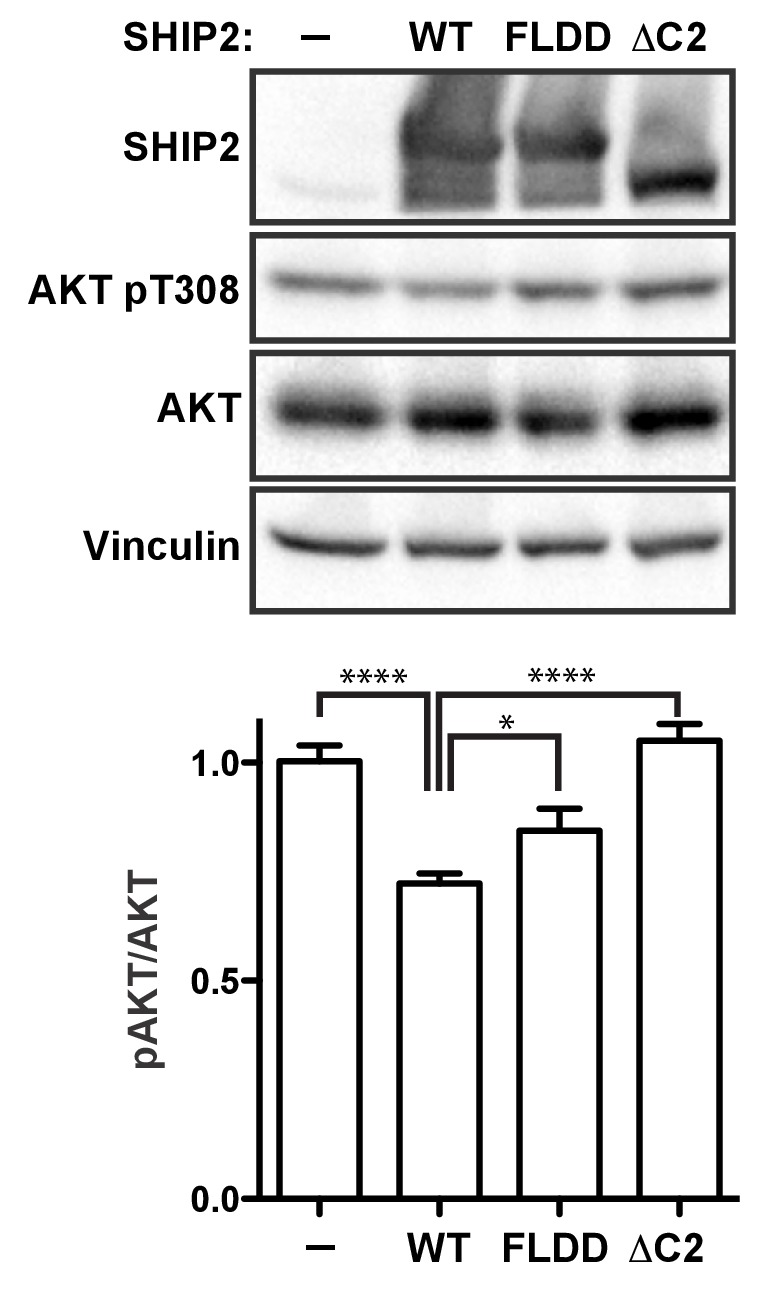
Figure 8—source data 1. Source data for graph in Figure 8.
Values are pAkt/totalAkt intensities, scaled relative to empty vector (-).The values in red were excluded. Numbers (#i) above data indicate independent experiment number. p-Values are calculated using a two-tailed unpaired Student t test assuming Gaussian distribution. Exact p-values are shown if >0.001. *Replicas from experiment #2 were loaded on different gels and scaled relative to empty vector (i.e. all scale to 1). Therefore empty vector values of experiment #2 are excluded in the statistical evaluation.
DOI: 10.7554/eLife.26640.030

Figure 8.

Figure 8—figure supplement 1. Quantification of SHIP expression levels.
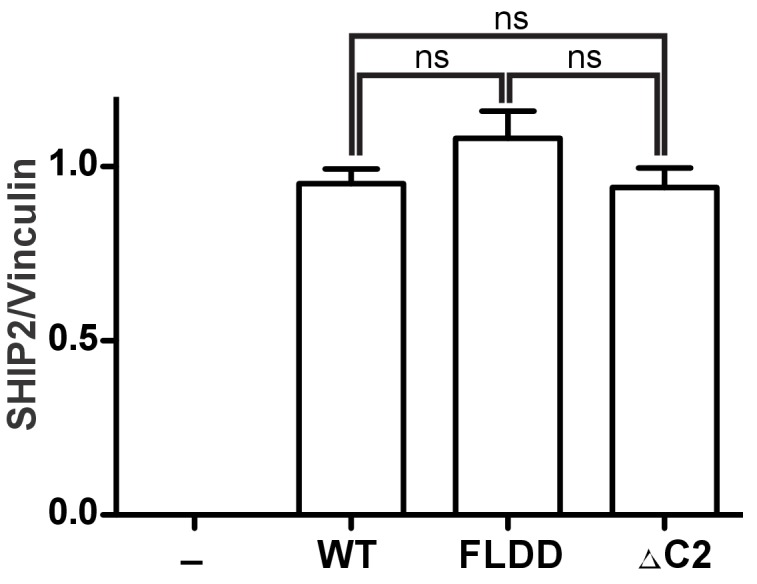
Figure 8—figure supplement 1.

HEK293 cells were transiently transfected with the empty vector (-) or vector expressing GST fused full-length SHIP2 constructs (WT, FLDD or ∆C2). Expression levels were assessed by quantifying immunoblots from eight independent experiments, each in triplicates (n = 24). ns: p>0.05 (unpaired Student t test).
Figure 8—figure supplement 1—source data 1. Source data for graph in Figure 8—figure supplement 1.
Values are SHIP2/Vinculin intensities, scaled relative to wild type-SHIP2 (WT).The values in red were excluded. Numbers (#i) above data indicate independent experiment number. p-Values are calculated using a two-tailed unpaired Student t test assuming Gaussian distribution. Exact p-values are shown.
DOI: 10.7554/eLife.26640.032