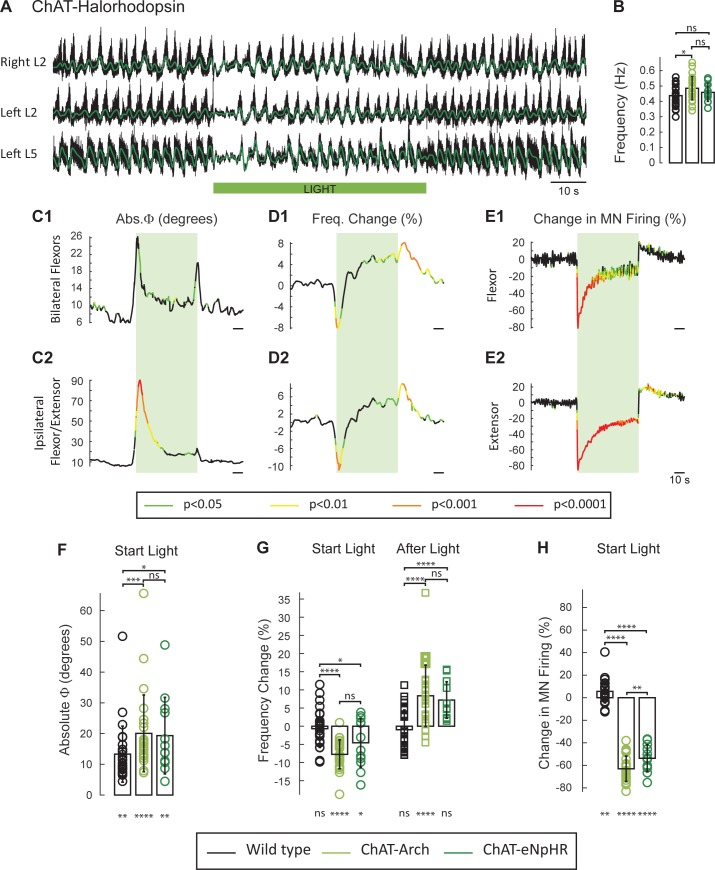
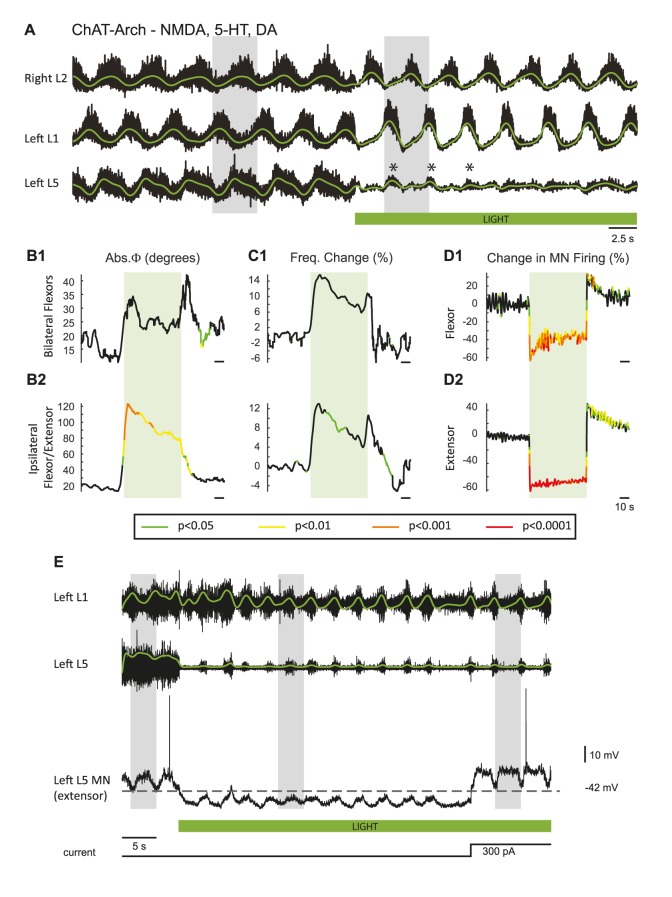
Figure 3. The light-induced decrease in the frequency of the rhythm and the phase changes are not due to changes in pH.
(A) Locomotor-like activity recorded from the right and left L2 and the left L5 ventral roots (black traces) in a P1 ChAT-eNpHR animal. The superimposed green traces are the slow potentials obtained by low pass filtering the raw signals. The activity was evoked by applying 6 μM NMDA and 8 μM 5-HT and the green bar indicates the duration of the light (60 s). (B) Bar plot showing the average locomotor-like frequency in wild type (n = 28, black circles), ChAT-Arch (n = 25, light green circles) and ChAT- eNpHR (n = 12, dark green circles) cords before the light (ANOVA, p=0.0533, two-stage linear step-up procedure, *: p=0.0141). (C–D) Time series of the change in absolute phase (C) and frequency (D) averaged for all experiments for the bilateral flexor (C1–D1) and ipsilateral flexor-extensor roots (C2–D2). (E) Averaged integrated ventral root discharge (Change in MN firing) for the ipsilateral flexor (E1) and extensor (E2) ventral roots. The statistics are obtained using a bootstrap t-test between ChAT- eNpHR (n = 12) and wild type cords (n = 28). The statistics are color-coded as indicated in the box below the records. The green rectangles indicate the duration of the light (60 s). (F–G–H) Bar plots showing the average change in the absolute phase (F), frequency of the bilateral flexors (G) for the 10 s just before and just after the light is turned on (Start Light, circles) and the 10 s just before and just after the light is turned off (After Light, squares) for wild type (black), ChAT-Arch (light green) and ChAT- eNpHR (dark green) animals. (H) Bar plots showing the average change of the ipsilateral flexor root for the 10 s just before and just after the light is turned on (Start Light, circles). Using a two-way ANOVA, we calculated the statistical differences between the three groups of animals (genetic Identity, shown above the bars) and the differences between light on and light off (light status; shown below the bars). The results of the ANOVA for the frequency changes were (Light status: F(3, 248) p<0.0001, Genetic identity F(2,248) p=0.0276, Interaction F(6,248): p<0.0001), for the absolute phase changes were (Light status: F(3, 248) p<0.0001, Genetic identity F(2,248) p<0.0001, Interaction F(6,248): p=0.8341), and for the changes in motoneuron firing were (Light status: F(3, 248) p<0.0001, Genetic identity F(2,248) p<0.0001, Interaction F(6,248): p<0.0001*p<0.05, **p<0.01, ***p<0.001, ****p<0.0001.
DOI: http://dx.doi.org/10.7554/eLife.26622.006


