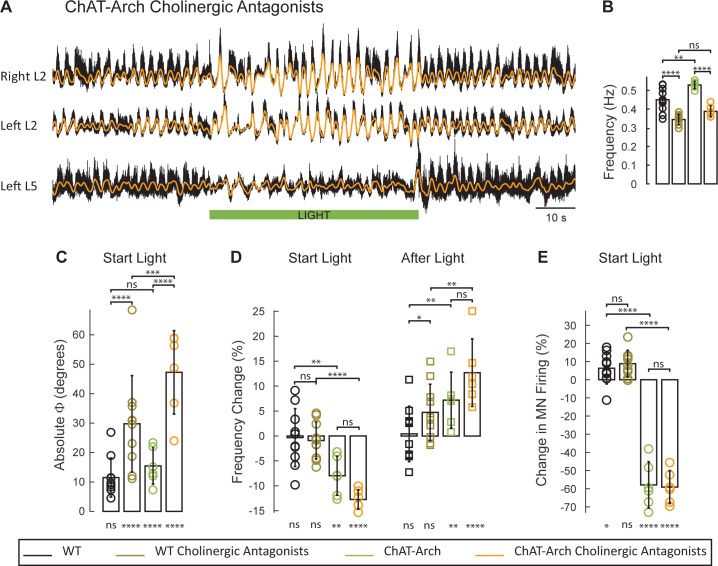
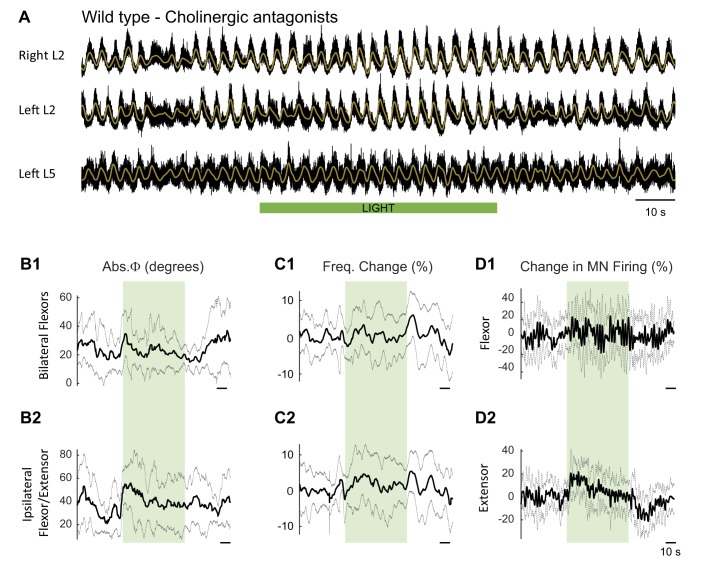
Figure 6. The light-induced disruption of the locomotor-like rhythm is exacerbated in the presence of cholinergic antagonists.
(A) Ventral root recordings (Right L2, and Left L2 and L5) showing the effect of light on the locomotor-like rhythm evoked by 5 μM NMDA and 10 μM in the presence of 50 μM mecamylamine, 50 μM dhβE, and 5 μM atropine. The superimposed orange traces are the slow potentials obtained by low pass filtering the raw signal. The green bar indicates the duration of the light (60 s). (B–E) Comparison between WT (black, brown), ChAT-Arch (green, orange) cords in the absence or presence of cholinergic antagonists. (B) Bar plot showing the average locomotor-like frequency in WT (n = 10) and ChAT-Arch (n = 6) cords under control conditions (no light) in the absence or presence of cholinergic antagonists (ANOVA, p<0.0001). (C–E) Bar plots showing the average change in the absolute phase (C), frequency (D) of the bilateral flexors for the 10 s just before and just after the light is turned on (Start Light, circles) and the 10 s just before and just after the light is turned off (After Light, squares). (E) Bar plot showing the averaged integrated neurogram (Change in MN firing) of the ipsilateral flexor root for the 10 s just before and just after the light is turned on (Start Light, circles) for WT (black, brown), ChAT-Arch (green, orange) cords in the absence or presence of cholinergic antagonists. Using a two-way ANOVA we calculated the statistical differences between the three groups of animals (genetic Identity, shown above the bars) and the differences between light on and light off (light status, shown below the bars). The results of the ANOVA for the changes in the variables were: absolute phase (Light status: F (3,112) p<0.0001, Genetic identity/Drug treatment: F(3,112) p<0.0001, Interaction F(9,112) p=0.0017), frequency (Light status: F (3,112) p<0.0001, Genetic identity/Drug treatment: F(3,112) p=0.3073, Interaction F(9,112) p<0.0001), and motoneuron firing (Light status: F (3,112) p<0.0001, Genetic identity/Drug treatment: F(3,112) p<0.0001, Interaction F(9,112) p<0.0001). *p<0.05, **p<0.01, ***p<0.001, ****p<0.0001.
DOI: http://dx.doi.org/10.7554/eLife.26622.022


