. 2017 Jul 25;6:e25681. doi: 10.7554/eLife.25681

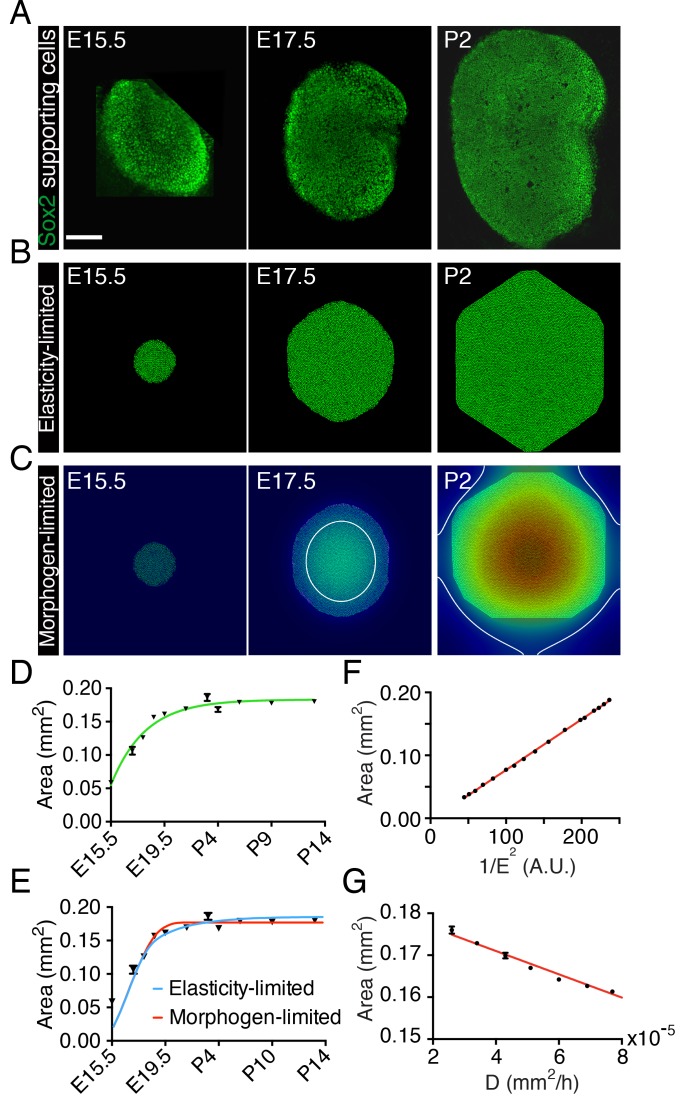
Figure 1. Size control in utricular development.

(A) Immunolabeling of supporting cells with anti-Sox2 (green) demonstrates the size of the utricular sensory epithelia of mice at E15.5, E17.5, and P2. The scale bar represents 100 μm. (B) Simulations of the elasticity-limited model portray sensory epithelia at the same developmental stages (Source code 1Table 1). (C) In simulations of the morphogen-limited model, the concentration of the diffusible morphogen [M] is shown on a spectral scale from blue as zero to red as the maximum, 0.2 pM. The white curve bounds the region in which a concentration exceeding the threshold value [M]TH = 0.04 pM inhibits cellular proliferation (Source code 2Table 1). (D) The measured areas of sensory epithelia at different developmental stages (black triangles; means ± SEMs; Figure 1—source data 1) are fit by the von Bertalanffy equation (green curve; A = 1.8·10−7 ± 5.8·10−9 m2, r = 3.6·10−6 ± 5.8·10−7 s−1, t0 = −1.32·10−5 ± 3.7·10−6 s−1, R2 = 0.94). (E) The same data are portrayed with fits of the elasticity-limited model (blue curve, R2 = 0.74) and morphogen-limited model (red curve, R2 = 0.62). Each result represents the average of five realizations; the SEM is typically around 1% (Figure 1—source datas 3,5). (F) Final areas of utricular sensory epithelia from simulations of the elasticity-limited model (means ± SEMs, N = 3) for different values of the Young’s modulus of the elastic boundary E. The areas are proportional to 1/E2 (black dots) and fit the linear relation Y = 0.000804·X - 0.00361 (red line, R2 = 0.99; Figure 1—source data 2). (G) Final areas of utricular sensory epithelia from simulations of the morphogen-limited model (means ± SEMs, N = 3) are linearly related to the diffusion coefficient D (black dots) by the relation Y = −278·X - 0.182 (red line, R2 = 0.98; Figure 1—source data 4).

DOI: http://dx.doi.org/10.7554/eLife.25681.002

Figure 1—source data 1. The areas of utricular sensory epithelia measured at different developmental stages.
DOI: 10.7554/eLife.25681.003
Figure 1—source data 2. Final areas of utricular sensory epithelia from simulations of the elasticity-limited model for different values of the Young’s modulus of the elastic boundary E.
DOI: 10.7554/eLife.25681.004
Figure 1—source data 3. Fits of the elasticity-limited model to the areas of utricular sensory epithelia measured at different developmental stages.
DOI: 10.7554/eLife.25681.005
Figure 1—source data 4. Final areas of utricular sensory epithelia from simulations of the morphogen-limited model for different values of the diffusion coefficient D.
DOI: 10.7554/eLife.25681.006
Figure 1—source data 5. Fits of the morphogen-limited model to the areas of utricular sensory epithelia measured at different developmental stages.
DOI: 10.7554/eLife.25681.007

Figure 1.

Figure 1—figure supplement 1. Geometry of the utricle and simplification to a mathematical model.

Figure 1—figure supplement 1.

(A) In a transverse section of a utricle at E17.5, Sox2-positive cells (green) form the sensory epithelium that sits at the bottom of the fluid-filled organ. Myo7A (red) labels hair cells. DAPI (blue) stains the nuclei of all the cells in the utricle and demonstrates the presence of Sox2-neganive non-sensory cells that are contingent with the sensory epithelium and are lining the rest of the utricle. The mesenchyme surrounding the utricle is also visualized by DAPI staining. (B) In a schematic representation, the utricle is surrounded by mesenchymal cells (light blue) that attach it to the surrounding cartilage (purple). We term both these tissues the elastic matrix. This matrix exerts compressive elastic forces that oppose the expansion of the utricle (red arrows), These forces are transmitted tangentially to the inner layer of the ellipsoidal chamber and act on the transitional non-sensory epithelium (blue), which then opposes the expansion of the sensory epithelium (green and magenta). The effective elastic force is the sum of that owing to the transitional epithelium and the tangential force applied by the elastic matrix (orange arrows). (C) We simplify the treatment of the model by considering the utricle as a two-dimensional structure. The sensory epithelium (green) forms a surface that is surrounded by a band of translational epithelium of inner radius R1 and outer radius R2 and with a Young’s modulus E1 (blue). This epithelium is in turn bounded by an elastic matrix of inner radius R2 and Young’s modulus E2 (purple). The transitional epithelium and elastic matrix can be treated as one effective material of Young’s modulus E, which we term the surrounding elastic band (orange fringes).