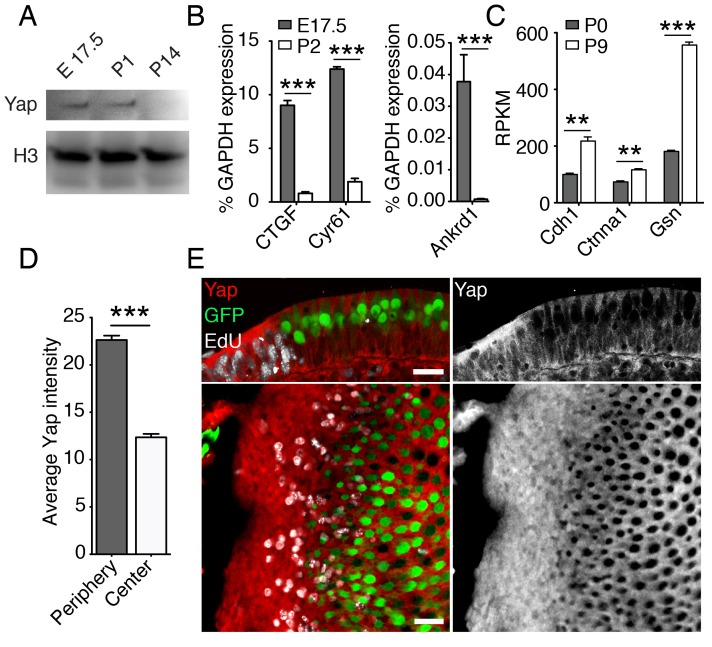
Figure 3. Yap signaling during utricular development.
(A) Western blot analysis of the total protein extracted from normally developing murine utricles demonstrates a progressive decrease in the level of Yap protein. (B) qPCR analysis of normally developing murine utricles reveals significant decreases in the expression of the Yap target genes Ctgf, Cyr61, and Ankrd1 between E17.5 and P2 (means ± SEMs; p<0.001 for each; N = 6 for E17.5; and N = 9 for P2; Figure 3—source data 1). (C) RNA sequencing from normally developing murine utricles reveals a progressive increase in the expression of genes encoding inhibitors of Yap tranlocation to the nucleus—Cdh1, Ctnna1, and Gsn—between P0 and P9 (means ± SEMs; p<0.005 for Cdh1, p<0.005 for Ctnna1, and p<0.0001 for Gsn; N = 3 for each; Figure 3—source data 2). (D) The mean fluorescence intensity of antibody labeling for Yap is significantly higher at the periphery than near the center of the utricle (value range 0–85; means ± SEMs; p<0.0001; N = 4 for each; Figure 3—source data 3) (E) In cross-sections (top panels) of the peripheral utricular sensory epithelium of E17.5 Atoh-nGFP mice 4 hr after EdU treatment, antibody labeling demonstrates Yap protein (red at left; white at right) in actively proliferating cells labeled with EdU (white at left). Hair cells (green) do not express Yap. In a different specimen this pattern of labeling is demonstrated in surface views (bottom panels). The scale bar represents 25 μm.
DOI: http://dx.doi.org/10.7554/eLife.25681.017

