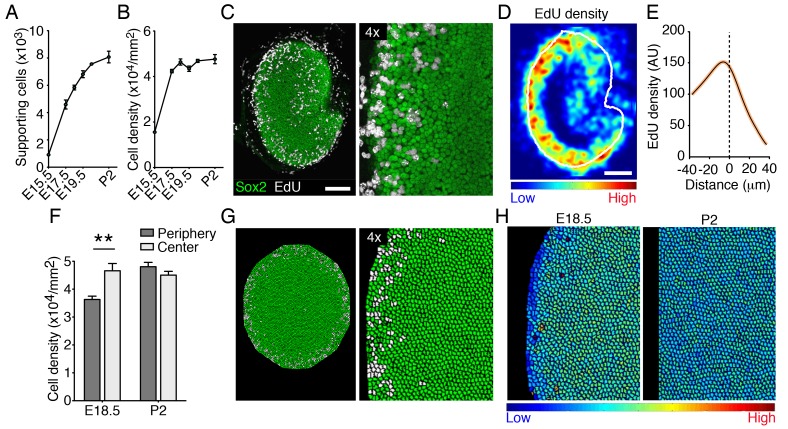
Figure 7. Cellular density and proliferation in the developing utricle.
(A) The numbers of supporting cells in utricular sensory epithelia increases significantly from E15.5 to P2 (means ± SEMs; p<0.05, N = 5 for each; Figure 7—source data 1). (B) The supporting-cell density grew significantly from E15.5 to E17.5 (means ± SEMs; p<0.05, N = 5 for each; Figure 7—source data 2) and plateaus thereafter. (C) In the Sox2-positive utricular sensory macula (green) of an E18.5 embryo exposed to EdU 12 hr earlier, dividing supporting cells (white) can be seen at the organ's periphery. The scale bar represents 100 μm. (D) The intensity of EdU labeling and the outline of the utricular macula (white line) are averaged for five E18.5 utricles to demonstrate the consistent pattern of supporting-cell proliferation at the corresponding developmental stage. (E) The distribution of EdU intensity shown in (D) demonstrates a clear peak that lies immediately inward from the macular boundary (dashed line). The standard errors are less that 1% and are shown by the orange area around the curve (Figure 7—source data 3). (F) The supporting-cell density at E18.5 is significantly higher at the center of the utricular macula than that at the organ's periphery (means ± SEMs; p<0.01, N = 4 for each; Figure 7—source data 4). There is no significant difference in supporting-cell density between the periphery and the center of the macula at P2 (means ± SEMs; p>0.05; N = 4 for each; Figure 7—source data 4). (G) Simulations of EdU labeling in the elasticity-limited model at E18.5 resemble the distribution of proliferating supporting cells seen experimentally at the same developmental stage. (H) The same simulation demonstrates the gradient in internal cell pressure in the E18.5 utricle. Areas of low pressure, and therefore of low cellular density, occur at the periphery; high pressure is predicted at the macular center. The gradient in cellular pressure disappears at P2.
DOI: http://dx.doi.org/10.7554/eLife.25681.037

