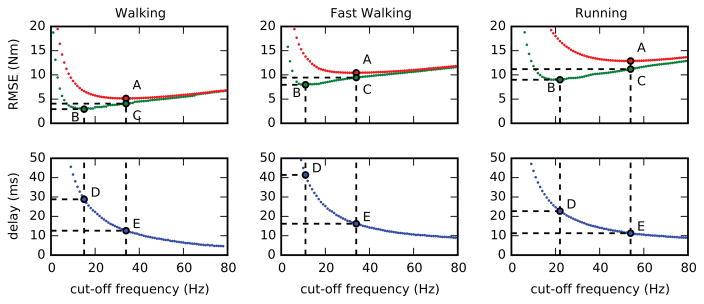
Figure 5.
Mean RMSE (red), time-aligned-RMSE (green) and time delays (blue) between joint moments calculated offline (low pass filtered at 6 Hz) and in real-time as a function of the real-time cut-off frequency for 60 consecutive seconds of walking, fast walking, and running divided in single gait cycles. The points A and B represent the global minima of the two RMSE curves, D and E the respective time delays and C is the projection of the point A onto the time-aligned-RMSE curve. Time delays were calculated from cross-correlation analysis.

