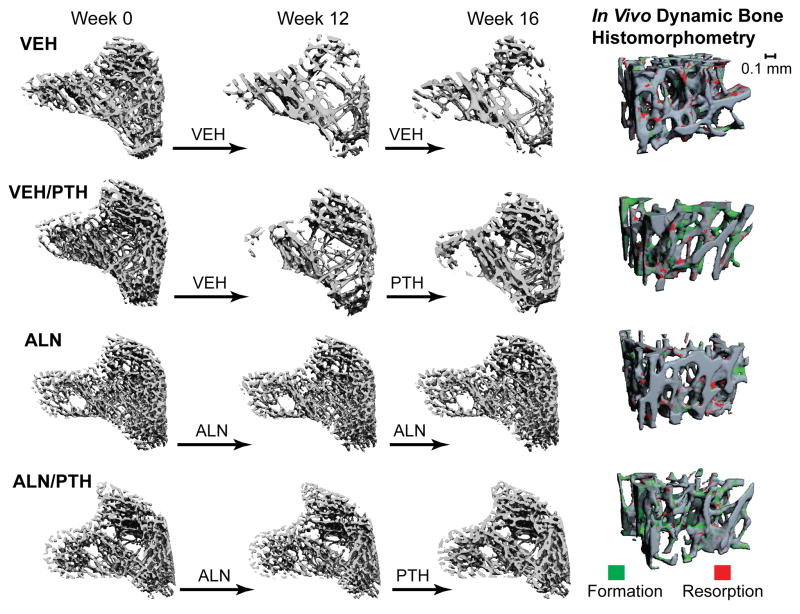
Figure 2.
Left: Registered comparison of tibia bone segments at week 0, 12, and 16 with treatment indicated by the arrows between time points. Right: 3D in vivo bone dynamic histomorphometry. Green indicates areas of new bone formation, and red indicates areas of bone resorption during the final week of treatment (week 15–16).

