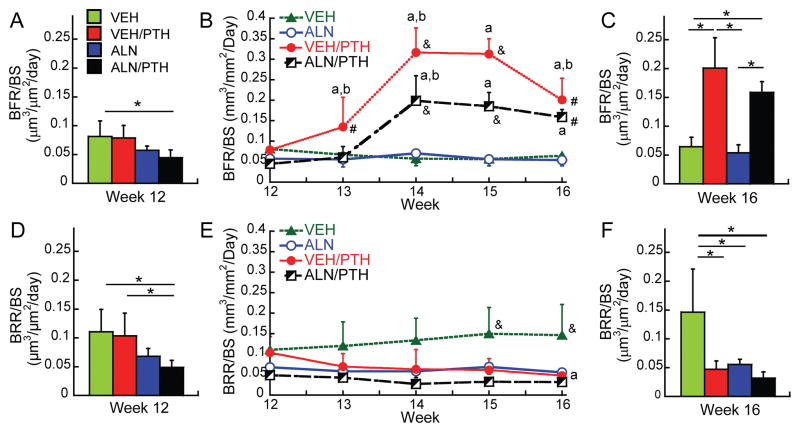
Figure 6.
(Left and right panels) group comparisons in bone formation rate (BFR/BS) and bone resorption rate (BRR/BS) at the beginning of the Phase 2 treatment (week 12, A&D) and the end of Phase 2 (week 16, C&F); * indicates a significant difference between treatment groups. (Middle panel) longitudinal changes in (B) BFR/BS and (E) BRR/BS of each treatment group during the Phase 2. a significant difference from week 12; b significant difference from the previous week; # significant difference from VEH and ALN groups; & significant difference from all other groups.

