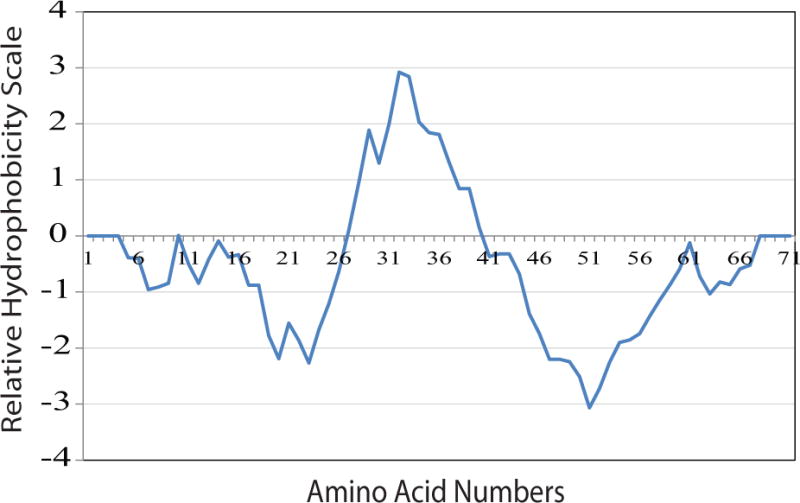
Figure 2. Hydrophobicity plot for the full-length agnoprotein.

This plot was generated according the method established by Kyte and Doolittle, which was implemented in protscale, on the Expasy Server (http://web.expasy.org/protscale/). The curve displays the hydrophobic and hydrophilic regions of agnoprotein.
