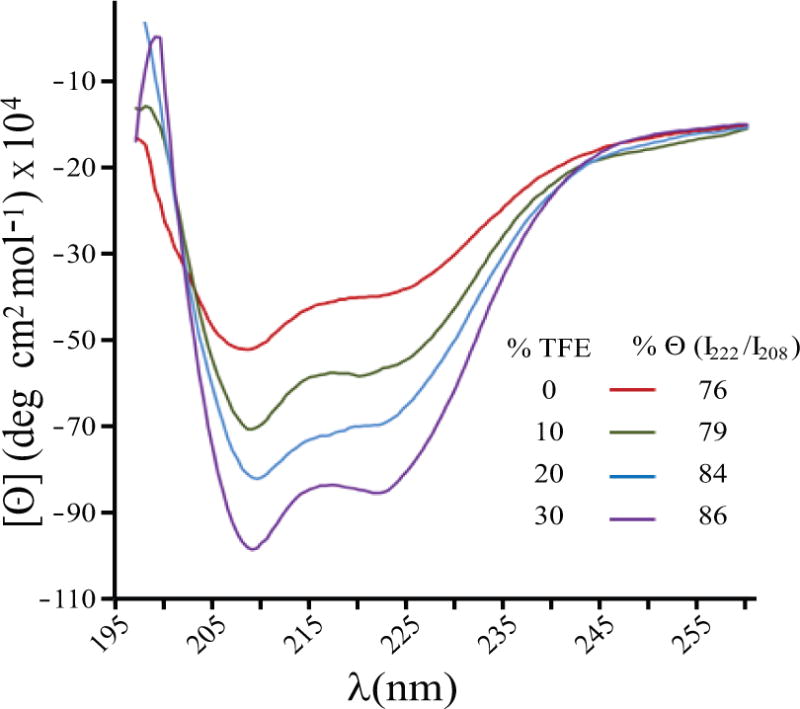
Figure 3. Circular Dichroism (CD) spectra of the full-length agnoprotein.

The spectra were recorded at room temperature (20°C) in a 0.1 cm path-length quartz cell on a Jobin-Yvon model C8 spectropolarimeter, calibrated with d-camphor-10-sulfonate. The experiments were performed at pH 3.0 in 100 % H20 (red spectra) as well as in various concentrations of the H2O/TFE mixture [H2O/TFE, (v/v), 90/10 (green), 80/20 (blue), and 70/30 (purple)]. The characteristic negative bands at 208 nm (parallel π → π* transitions) and at 222 nm indicate the formation of an α-helix stabilized by the TFE. The peptide concentration in each sample was 50 μM. The stability of the α-helix can be monitored by the value of the minima and maxima of Θ. The % (I222/I208) indicates the fraction of α-helical structure that slightly increases with the fraction of TFE used.
