
Figure 4. Comparison of the 1D1H NMR spectra performed on the full-length agnoprotein in various solvent conditions.
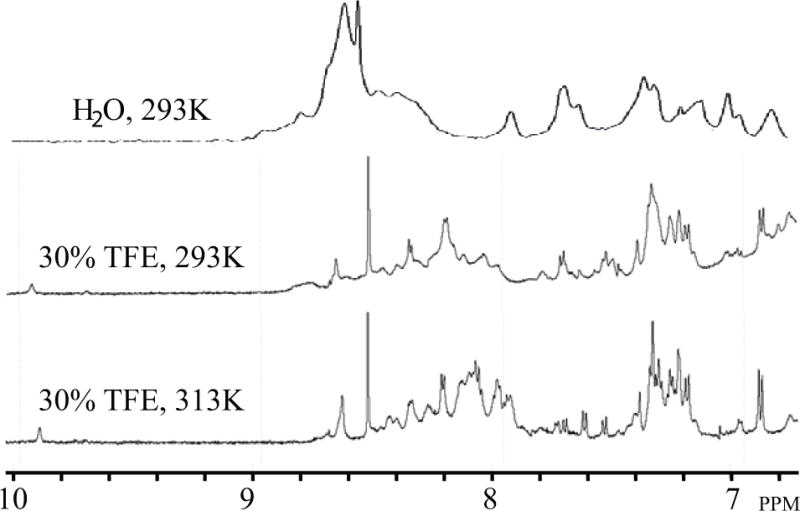
The spectra were acquired on an Avance Bruker spectrometer operating at 600.13 MHz, equipped with a cryoprobe. Various conditions were tested to prevent the aggregation and to increase the solubility of agnoprotein. The protein concentration was 0.2 mM in all experiments conducted. (Upper trace) The protein appeared to be aggregated with very broad peaks in pure water, at pH 3.0 and 293°K. (Middle trace) In presence of 30% (v/v) TFE and at pH 3.0 and 293°K, the protein started to solubilize with a large spreading of the chemical shifts but the linewidth remained relatively broad. (Lower trace) Under the same conditions as stated for “middle trace”, but at temperature of 313°K, we obtained spectra with a narrower linewidth.